Introduction
An interocclusal record is the registration of the positional relationship of the opposing teeth or the jaws to each other (GPT- 8). Inaccurate interarch registration leads to errors in diagnosis and treatment.
The ideal interocclusal recording material should be easy to handle, exhibit minimal dimensional changes during and after setting. It should offer adequate resistance to closure during the mounting of casts[1]. Interocclusal records help in planning occlusal rehabilitation and determine single positional relationship of lower jaw to upper jaw in various centric and eccentric positions. They are also used to correct occlusal discrepancies on an articulator[2]. Effect of lateral shift of mandible can be incorporated into the scheme of balanced occlusion[3],[4],[5].
Plaster[6],[7], impression compound, wax[8], zinc oxide eugenol paste, eugenol free zinc oxide paste, acrylic resin and elastomeric materials are materials routinely used for registration of occlusal relationships. Recently, polyether and polyvinylsiloxane elastomeric materials have been introduced.
The records must be dimensionally stable until articulated else there may occur vertical and horizontal discrepancies in the interocclusal relationships of the casts. So more of occlusal adjustments will have to be made for the prosthesis, crowns or fixed partial dentures, in the mouth. A compressive force is commonly exerted on the recording material during its removal from the patient’s mouth and during articulation which causes vertical and horizontal inaccuracies during mounting resulting in faulty restorations. So resistance of these recording materials against compressive forces is important. The material gets deformed when compressed under a load. The deformation may vary with the thickness and properties of recording materials used. Thickness of interocclusal record is lesser in fixed partial denture cases. It is more in complete denture cases.
Sometimes, it takes time to carry interocclusal records to distant laboratories or there may be delay in the articulation of casts in the laboratory. This time interval also affects the properties of the recording material used. Some materials can be safely stored for long periods while others cannot be.
This study has been undertaken to evaluate the linear dimensional change and compressive resistance of different thicknesses of different interocclusal recording materials over different time intervals.
Materials And Methods
The materials and method used in the study can be described under following:
Materials and armamentarium used
Manipulation of materials
Materials And Armamentarium
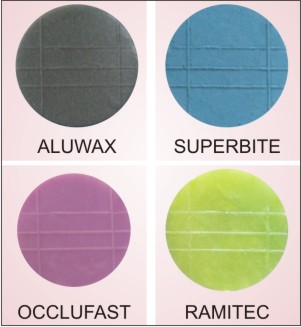
Bite registration wax (Aluwax, Aluwax Dental Products Co., USA) [Fig.I]
Zinc Oxide Eugenol bite registration paste (Superbite, Bosworth, USA) [Fig.I]
Polyvinylsiloxane bite registration material (Occlufast, Zhermack, Italy) [Fig.I]
Polyether bite registration material (Ramitec, 3 M, Germany) [Fig.I]
Hot water bath [Fig.II]
Clamp [Fig.III]
Tweezer, Mixing Pad & Mixing Spatula [Fig.III]
Automatic mixing syringe and dispensing gun (Haereus Kulzer) [Fig.III]
Profile Projector (Dynascan, accuracy = 0.001 mm) [Fig.IV]
Universal testing machine (Instron ,accuracy = 0.005 mm) [Fig.V]
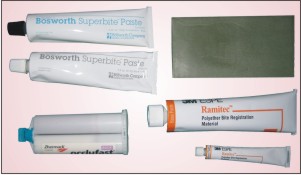 | Fig.I: Materials used in the study A. Superbite B. Aluwax C. Occlufast D. Ramitec
 |
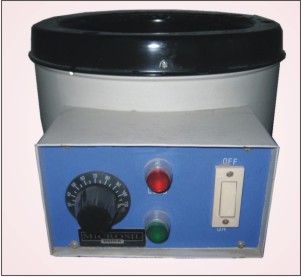 | Fig.II : Hot water bath
|
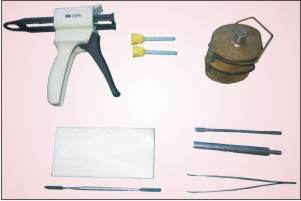 | Fig.III : Armamentarium
|
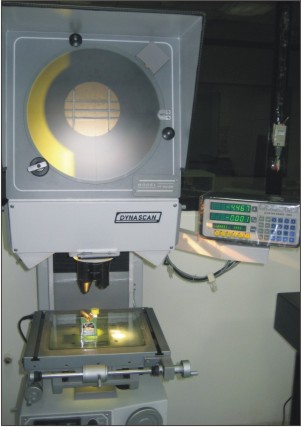 | Fig.IV : Sample being measured under Profile Projector
|
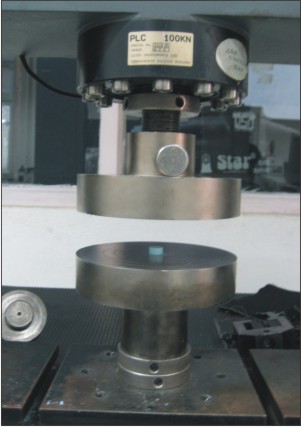 | Fig.V : Sample being tested under UTM for compressive resistance
|
Split mold assembly (Fig.VI):
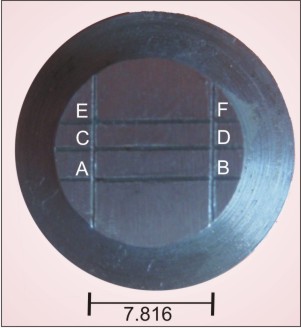
Split mold assembly included a master die with reference lines, a split mold, outer circular ring and a flat rectangular metal plate (Fig.VII). Master die was a stainless steel solid cylinder, 10 mm in height, fixed to a stainless steel circular base. Reference lines as per ADA specification no. 19 were engraved on the superior surface of cylinder. Three horizontal lines, in the centre of circle equidistant from each other were intersected by two vertical lines such that distance AB=CD= EF= 7.816 mm (Fig.VIII).
A split mold consisted of two longitudinal halves of a hollow cylinder (Fig.VII). Three pairs of such hollow cylinders with a height of 12 mm, 14 mm and 16 mm were used so that samples could be obtained in three different thicknesses. Outer circular ring closely fitted around the mold assembly. A rectangular flat metal plate was used to extrude out excess material.
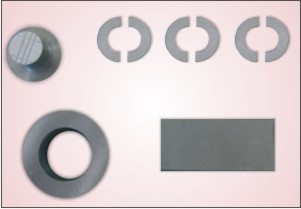 | Fig.VI : Split mold assFig.VI : Split mold assembly A. Master die with reference lines B. Split molds of different heights CFig.VI : Split mold assembly A. Master die with reference lines B. Split molds of different heights C. Outer circular ring D. Flat
|
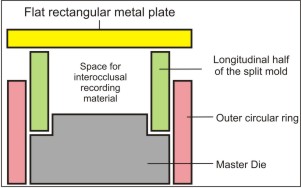 | Fig. VII : Diagram of Split mold assembly
|
 | Fig. VIII : Master die with reference lines
|
Manipulation Of Materials
The individual materials were manipulated according to manufacturer’s instructions. Aluwax was submerged in a hot water bath (40º- 45ºC) for 5 min and placed into the mold.
Polyether (Ramitec) and Zinc Oxide Eugenol (Superbite) were available in tubes as base paste and catalyst paste. Polyvinylsiloxane (Occlufast) supplied in automixing cartridges was injected into the mold by dispensing gun.
The mold assembly along with the clamp were submerged in a 32 + 10C water bath to simulate oral conditions for a time duration as per manufacturer’s recommendations.
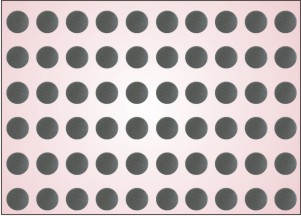
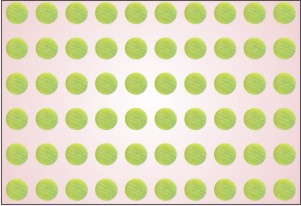
The samples were in the form of a disc with the impression of reference lines on the surface (Fig.IX). The samples were obtained in 3 thicknesses of 2 mm, 4 mm and 6 mm using split molds of different heights. The samples were divided into different groups.
 | Fig. IX: Samples of different interocclusal recording materials
|
Different groups under study:
Total of 120 samples were made from each material. 60 samples were tested for linear dimensional change and 60 samples were evaluated for compressive resistance. Out of each 60 samples, 20 samples each were obtained in thickness of 2mm, 4mm and 6mm respectively. 10 samples were tested after 1 hr and other 10 samples were tested after 24 hrs.
For linear dimensional change:-
The samples were divided into 4 main groups:
Group A:Bite Registration wax (Aluwax) (Fig.VIII)
Group B:Zinc oxide eugenol (Superbite) (Fig.IX)
Group C:Polyvinylsiloxane (Occlufast) (Fig.X)
Group D:Polyether (Ramitec) (Fig.XI)
Each main group has 3 subgroups:
Subgroup I: 20 samples with a thickness of 2 mm
Subgroup II:20 samples with a thickness of 4 mm
Subgroup III:20 samples with a thickness of 6 mm.
Within each subgroup, 20 samples were tested after 2 different time intervals i.e. after 1 hr and after 24 hrs. These were subgrouped as follows.
Subgroup 1:10 samples tested after 1 hr
Subgroup 24:10 samples tested after 24 hrs.
So different groups may be summarized as follows:
Group A: Subgroup I1 – Samples were denoted as Ai1
Subgroup I24 – Samples were denoted as Ai24
Subgroup II1 – Samples were denoted as AII1
Subgroup II24 – Samples were denoted as AII24
Subgroup III1 – Samples were denoted as AIII1
Subgroup III24 – Samples were denoted as AIII24
Similarly for groups B, C and D.
For compressive resistance: Similar grouping was done for samples tested for compressive resistance and were denoted as A’ I1 , A’ I24, A’ II1, A’ II24 and so on.
The measurements were done using Profile Projector (for linear dimensional change) and Universal testing machine (for compressive resistance). Linear dimensional change was tested by measuring the distance A-B, C-D and E-F and calculating their mean (Fig.IV). Compressive resistance was tested by measuring deflection (mm) on an Instron Universal Testing Machine under a constant compressive force of 25 Newton (Fig.V). Greater the deflection for a particular material, lesser is the compressive resistance of that material. After the readings were obtained, they were compared with the dimensions on the die, tabulated and subjected to analysis by using one-way ANOVA test.
 | Fig. X : Group A samples
|
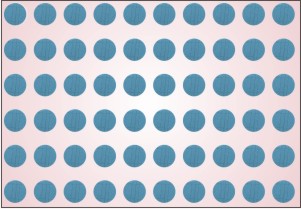 | Fig. XI : Group B samples
|
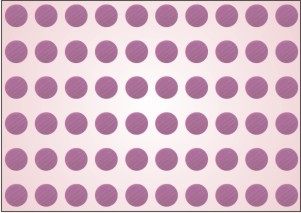 | Fig. XII : Group C samples
|
 | Fig. XIII : Group D samples
|
Observations & Results
The observations and results of the study can be summarized in the following tables:
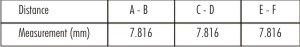 | Table I – Distances On Master Diee
|
This table shows the distances A-B, C-D and E-F (linear dimensions) on the master die as measured by Profile Projector.
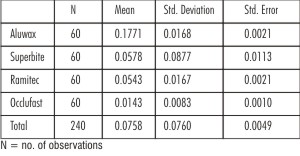 | Table II – Mean Linear Dimensional Change (In Mm) Among Different Materials.
|
Aluwax shows the maximum linear dimensional change and Occlufast shows the minimum linear dimensional change among all the materials.
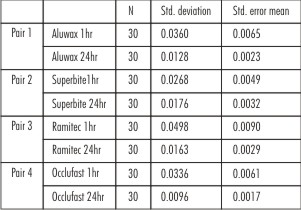
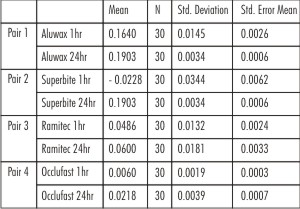 | Table III – Mean Linear Dimensional Change Among Different Materials After 2 Different Time Intervals.
|
All the materials except ZOE showed shrinkage at the end of 1hr which increased at the end of 24hrs. ZOE showed initial expansion after 1hr and shrinkage after 24hrs.
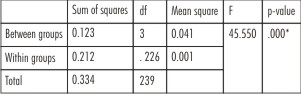
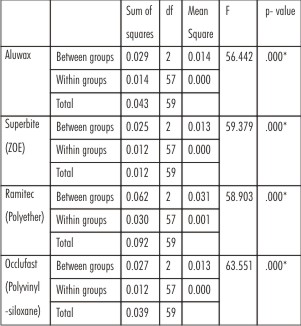
 | Table IV – Comparison Of Linear Dimensional Change Measured Among Different Materials After 2 Different Time Intervals By One – Way Anova.
|
There is significant linear dimensional change for each material at the end of 1 hr and 24 hrs.
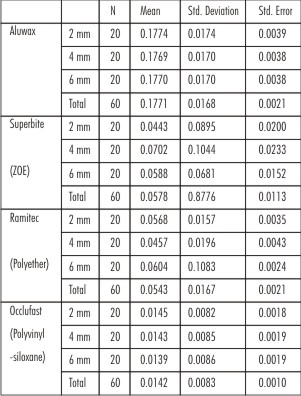 | Table V : Mean Linear Dimensional Change Among Different Thicknesses Of Different Materials.
|
For each material, the compressive resistance decreased (mean deflection increased) as the thickness increased. So, the highest degree of compression resistance for each of the materials tested was seen at 2 mm thickness.
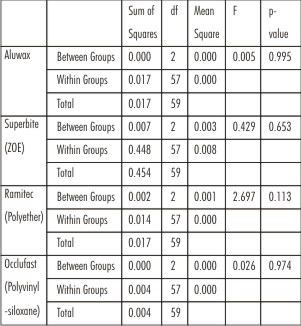 | Table VI : Comparison Of Linear Dimensional Change Measured Among Different Thicknesses Of Different Materials By One-way Anova.
|
There is no significant difference in linear dimensional change among different thicknesses of different materials.
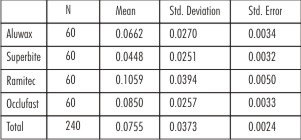 | Table VII : Mean Deflection (Mm) Measured Among Different Materials.
|
Aluwax exhibits maximum compressive resistance (minimum mean deflection) followed by Occlufast (polyvinylsiloxane) > Ramitec (polyether) > Superbite (ZOE).
 | Table VIII : Comparison Of Deflection (Mm) Measured Among Different Materials By One – Way Anova.
|
There is significant difference in compressive resistance among different materials.
 | Table IX : Comparison Of Deflection (Mm) Measured Among Different Thicknesses Of Different Materials By One – Way Anova.
|
There is significant difference in compressive resistance among different thicknesses of each material.
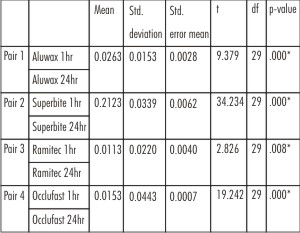
 | Table X : Mean Deflection (Mm) Measured Among Different Materials After 2 Different Time Intervals.
|
The compressive resistance of each material increased (mean deflection decreased) at the end of 24 hrs when compared to the compressive resistance at the end of 1 hr.
 | Table XI : Comparison Of Deflection (Mm) Measured Among Different Materials After 2 Different Time Intervals By One – Way Anova.
|
There is a significant difference in compressive resistance at 2 different time intervals for each material except for Aluwax.
Discussion
When linear dimensional change was evaluated , it was observed that none of the samples obtained from different interocclusal recording materials were exactly similar to the master die in linear dimensions.
Occlufast (Polyvinylsiloxane) was the most dimensionally stable material (Table – II, Graph 1) because there are no byproducts or loss of volatile substances on setting. There was slight but significant shrinkage at the end of 1 hr which progressively increased till 24 hrs (Table – III, IV, Graph 3). This might be due to polymerization shrinkage.
Ramitec (Polyether) stands at second place (Table – II, Graph 1). This might be due to absorption of moisture from the environment by hydrophilic polyether and simultaneous more leaching of the water soluble plasticizer. So significant shrinkage at the end of 1st hr increases at the end of 24 hrs (Table –III,IV, Graph 3).
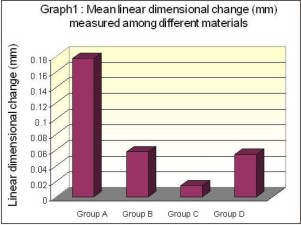 | Graph 1: Mean linear dimensional change (mm) measured among different materials
|
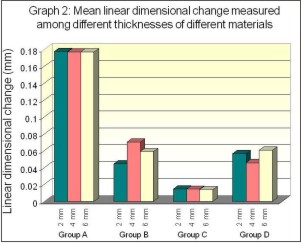 | Graph 2: Mean linear dimensional change measured among different thicknesses of different materials
|
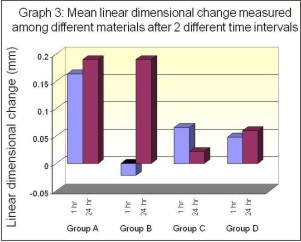 | Graph 3: Mean linear dimensional change measured among different materials after two different time intervals
|
Superbite (Zinc oxide eugenol), next to Ramitec (Table – VI, Graph 1) undergoes setting via chelation reaction. Initial expansion at the end of 1hr is followed by significant contraction at the end of 24 hrs (Table – III, IV, Graph 3). This might be due to evaporation of water.
Aluwax (Bite registration wax) showed the greatest linear changes of all the materials (Table – II, Graph 1) due to greater coefficient of thermal expansion and distortion due to stress release. The shrinkage was even greater at the end of 24 hrs (Table –III, IV, Graph 3).
None of the materials showed any significant change in linear dimensions for the different thicknesses (Table – V, VI, Graph 2). This concludes that dimensional stability of an interocclusal record material is independant of the thickness of material.
Craig and Peyton[9] in 1975 stated that there was shrinkage of polyether at the end of 24 hrs. This concurred with the results of the present study.
Dua and Gupta[10] in 2007 compared the linear dimensional change of polyvinylsiloxane and polyether interoccclusal recording materials after 24 hrs of fabrication. They concluded that polyvinylsiloxane exhibited lesser linear dimensional change in the horizontal plane than the polyether recording material.
Compressive resistance of different materials in the descending order: Aluwax > Occlufast (polyvinyl siloxane) > Ramitec (polyether) > Superbite (ZOE) [Table – VII, VIII, Graph 4]. The tables denote the values of deflection (mm) for different materials. Greater the deflection observed in a particular material under a constant load, lesser is the compressive resistance of that material.
Aluwax is difficult to use with maximum compressive resistance. It would not be easily deformed by the occluding pressure in the mouth. The interocclusal registrations made with Occlufast had a tendency to deform due to compressive forces during mounting of articulator.
Ramitec (polyether) had lesser compressive resistance than Occlufast. However, there is a ‘spring’ to this elastomer that can cause articulated casts to ‘open’ in the centric closure position. If Polyether is not trimmed and carefully seated into the casts, it can be more inaccurate than any other material examined in this study.
Superbite (ZOE) had the minimum compressive resistance as the material is hard and brittle after setting.
It was found that for each material, the compressive resistance decreased as the thickness increased. So, the highest degree of compression resistance was seen at 2 mm thickness (Table – V, IX, Graph 5) because a thicker sample provides a greater volume of material for the deflection as compared to a thinner sample.
Observing the effect of time interval on compressive resistance of each material, it was seen that the compressive resistance of each material increased from 1 hr to 24 hrs (Table – X, XI, Graph 6). This might be because each material became more rigid with time exhibiting lesser defection and greater compressive resistance.
Veijo Lasilla[12] in 1985 compared the different interocclusal recording materials and observed that compressive resistance was in the following order: Wax > Polyether > ZOE.
The use of 25 N load simulated a mounting procedure in which rubber band was used to securely approximate the casts during mounting procedure.
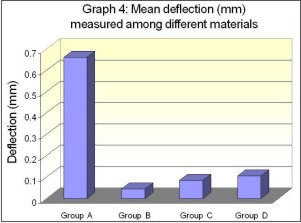 | Graph 4: Mean deflection (mm) measured among different materials
|
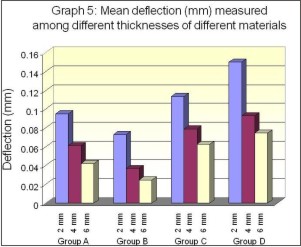 | Graph 5: Mean deflection (mm) measured among different thicknesses of different materials
|
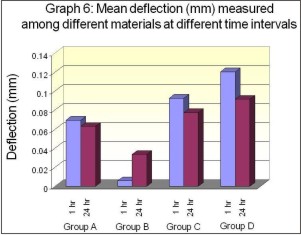 | Graph 6: Mean deflection (mm) measured among different materials at different time intervals
|
Conclusion & Recommendations
Based on the present study, it may be recommended that Occlufast (Polyvinylsiloxane) can be used for occlusal registration of natural teeth, record blocks, removable or fixed restorations. It can be used in case of distant laboratories or delayed mounting of casts.
Superbite has a tendency to break during mounting procedures. It can be used only for occlusal registration of removable dentures or record blocks.
Aluwax is a reliable material only when it is left at the site of registration, for example, remounting of removable dentures.
Interocclusal registrations should be made at a minimal interocclusal distance as compressive resistance decreases with increasing thickness of the material.
Mounting of casts should be done as soon as possible because both linear dimensional change and compressive resistance increase with the passage of time. A very large increase in compressive resistance of interocclusal recording material may lead to improper seating of casts and hence wearing of casts.
References
1. Skurnik H. Accurate interocclusal records. J Prosthet Dent 1969; 21(2): 154-65
2. Kotwal KR. The need to use an arbitrary facebow when remounting complete dentures with interocclusal records.J Prosthet Dent 1979; 42(2) :224-26
3. Gehl DH, Payne SH. The use of lateral positional records in semiadjustable articulators. J Prosthet Dent 1973 ;29(3) : 330-33
4. Shillingburg HT, Hobo S, Whitsett LD. Fundamentals of fixed prosthodontics, 3rd edition. 35-46
5. Vere M. Lateral interocclusal positional records. J Prosthet Dent 1968; 19(4): 350-58
6. Payne SH. Selective occlusion. J Prosthet Dent 1955; 7: 770-86
7. Hickey JC. Centric relation. A must for complete dentures. Dent Clin North Am 1964 Nov.
8. Trappozano VR. Occlusal record. J Prosthet Dent 1955; 5: 325-32
9. Craig RG, Peyton F. Restorative dental materials. 5th edition. St. Louis 1975, The C.V Mosby Co.
10. Dua MP, Gupta SH, Ramachandran S, Sandhu HS. Evaluation of four elastomeric interocclusal recording materials. MJAFI 2007;63:237-40
11. Keyf F, Altunsoy S. Compressive strength of interocclusal recording materials. Braz Dent J 2001; 12(1):43- 6
12. Lassila V. Comparison of five interocclusal recording materials. J Prosthet Dent 1986; 55(2): 215-18
|