Introduction:
Rehabilitation of complete edentulism using osseointergrated implants can generally be regarded as the method of choice if there are no local and systemic contraindications. Osseointergrated endosseous implants are used in prosthodontics with high rate of success. Patient selection, treatment planning, implant design, suitable implant materials, good surgical technique and restorative treatment are critical for the success of the procedure. Bone quality and quantity varies from site to site and from patient to patient. Improved success rates for implants are in patients having good bone quality and quantity. Computed tomography is a noninvasive preoperative method and has the major advantage of enabling trabecular and cortical bone density to evaluate separately[1]. Optimum implant orientation can be aided by the 3-D radiographic data base provided by a computed tomography scan. The reformatted sectional images, when related to each other, facilitate a thorough visualization of the bone topography, sinus and nerve location and bone density. The study was designed to evaluate and compare the trabecular bone mineral density in males and females in edentulous maxilla for assessment of prospective implant sites.
Objectives:
• To evaluate bone mineral density in edentulous maxillary prospective implant sites.
• To compare trabecular and cortical bone mineral density of male and female edentulous patients at prospective implant sites of maxilla.
Methodology
An in vivo study was designed to evaluate the bone mineral density using computed tomography in maxilla of male and female edentulous subjects seeking implant therapy was conducted in the Dept of Prosthodontics and Dept of Radiology, St.Joseph dental college, Andhra Pradesh for assessment of prospective implant sites.
The materials and methods used for the study are described under the following headings:
1) Armamentarium used
2) Method employed
Armamentarium Used:
1. Irreversible Hydrocolloid (Zhermack)
2. Dental stone (Kalabhai Kalastone)
3. Plaster of Paris
4. Rubber bowl
1. Plaster mixing spatula
2. Cold mould seal separating medium(DPI Mumbai)
3. Petroleum jelly
4. Graphite pencil (0.5mm)
5. Gutta percha points (Dentsply)
6. Cyanoacrylate adhesive.
7. Autopolymerizing acrylic resin (DPI Mumbai)
8. Kodak T-Mat g/RA Panoramic dental film (Size 15x 30 cm).
9. Panoramic & linear tomographic radiograph machine (PLANMECA PM 2002 CC PROLINE).
10. CT films (Kodak Ektascan).
11. CT machine with Dental scan software (SIEMENS Somatrom ESPRIT PLUS).
12. Radiograph Viewer.
Method
A group of 24 edentulous subjects comprising of 12 males and 12 females between the age group of 45-50 years seeking implant supported prosthesis were selected for the purpose of this study. All the subjects were informed about the study and their written consent to participate in the study was taken.
Criteria For Selection:
The subjects were selected on the basis of the following criteria:
Subjects should be completely edentulous with no intra alveolar tooth remnants and seeking rehabilitation with implant supported prosthesis. The subjects were categorized into two groups of 12 males and 12 females. The patients had good general health and were deemed fit for implant therapy.
A diagnostic impression was made of the completely edentulous maxillary and mandibular arches and cast were poured (Fig-1). Using a graphite pencil prospective implant sites namely at the region of central incisor, lateral incisor, canine on either side of the arch were marked on the maxillary and mandibular cast. Guttapercha cones of diameter 1mm, height 1mm were fixed at the corresponding sites on the cast (Fig-2). A radiographic stent using autopoly merizing resins incorporating the guttapercha cones were prepared on the cast . Occlusal rims were prepared on these radiographic stent and adjusted for proper vertical and horizontal intermaxillary relation and were sealed in order to prevent movement of jaws during computed tomography procedure.
Computed tomography was done using a SIEMENS Somatrom ESPRIT PLUS fitted with a Kodak Ektascan 160 laser image was used. The patient was stabilized in a standardized position within the gantry (Fig-3). The densities of bone in the various sites (trabecular and cortical) were obtained by locating a cursor at various positions on the image and using Dental scan software program to determine the density which was expressed in the Hounsfield scale (Fig-4). The bone mineral density values were recorded on both sides of the maxillary jaw in the trabecular and cortical region and mean of these was obtained.
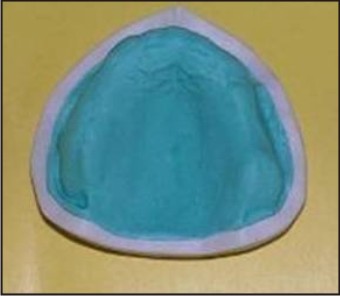 | Fig 1 : Diagnostic Maxillary Cast
 |
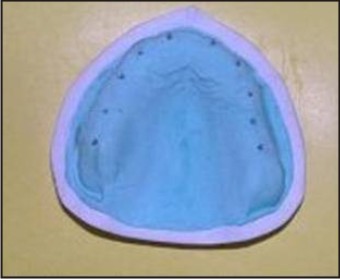 | Fig 2 : Gurrapercha Markers on Maxillary Cast
|
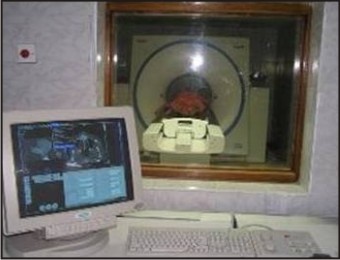 | Fig 3 : Computed Tomography
|
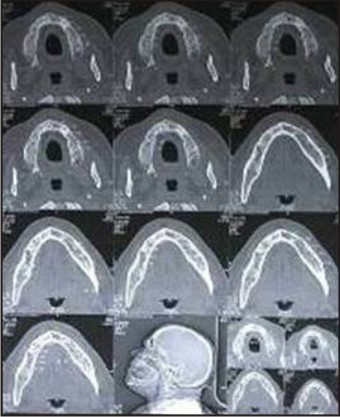 | Fig 4 : Computed Tomography of the Subject
|
The data thus obtained was tabulated and statistically analyzed using Mann Whitney U test and kruskal wallis test.
Results:
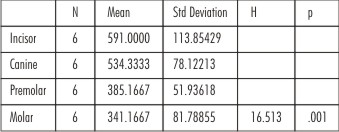
Comparison of bone mineral density in incisor, canine, premolar and molar areas in the trabecular region of maxilla in males in Hounsfield units (H.U).
 | Table 1
|
Table I - Shows the comparison of bone mineral density in incisor, canine, premolar and molar areas in the trabecular region of maxilla in males in Hounsfield units (H.U). The bone mineral density in the trabecular region of maxilla in the incisor areas was (591.0), canine areas was (534.3), premolar areas was (385.1) and molar areas was (341.1). in which density is more in the incisor and canine areas compared to the premolar and molar areas. Variation in the bone mineral density was found to be statistically highly significant (p=.001 sig).
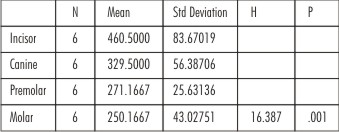
Comparison of bone mineral density in incisor, canine, premolar and molar areas in the trabecular region of maxilla in females in Hounsfield units (H.U).
 | Table 2
|
Table II - Shows the comparison of bone mineral density in incisor, canine, premolar and molar areas in the trabecular region of maxilla in females in Hounsfield units (H.U). The bone mineral density in the trabecular region of maxilla incisor areas was (460.5), canine areas was (329.5), premolar areas was (271.1) and molar areas was (250.1) in which density is more in the incisor and canine areas compared to the premolar and molar areas. Variation in the bone mineral density was found to be statistically highly significant (p=.001 sig).
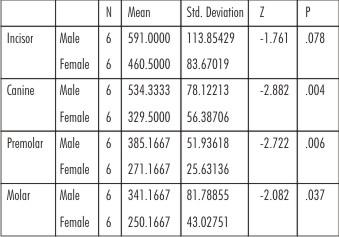
Comparison of bone mineral density in incisor, canine, premolar and molar areas in the trabecular region of maxilla in males and females in Hounsfield units (H.U).
 | Table 3
|
Table III - Shows the comparison of bone mineral density in incisor, canine, premolar and molar areas in the trabecular region of maxilla in the males and females in Hounsfield units (H.U)
The bone mineral density in thetrabecular region of maxilla in the incisor region of males is (591.0) and females is (460.5) Variation in the bone mineral density was found to be statistically not significant (p=.078.ns).
In the canine region of males is (534.3) and females is (329.5) Variation in the bone mineral density was found to be statistically highly significant (p=.004hs).
In the premolar region of males is (385.1), and females is (271.1) Variation in the bone mineral density was found to be statistically highly significant (p=.006hs).
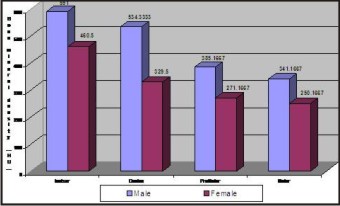
Comparison of bone mineral density in incisors, canine, premolar and molars in the trabecular region of maxilla in the males and females in hounsfield unit (Graph 1).
 | Graph 1
|
Bone mineral density has been measured by photodensitometry, photon absorptiometry and computed tomography. Of these methods computed tomography is a noninvasive preoperative method and widely accepted as the most precise means of evaluating the architecture of potential implant sites in the mandible and maxilla.[2] Computed tomography has the major advantage of enabling trabecular and cortical bone density to be evaluated separately.[3]
When the bone mineral density in incisor, canine, premolar and molar areas in the trabecular region of maxilla in males is compared as intable II,it was seen that the bone mineral density in the incisor areas was (591.0 H.U), canine areas was (534.3 H.U), premolar areas was (385.1 H.U) and molar areas was (341.1 H.U). Variation in the bone mineral density was found to be statistically highly significant. In females as intable Vbone mineral density in the incisor areas was (460.5 H.U), canine areas was (329.5 H.U), premolar areas was (271.1 H.U) and molar areas was (250.1 H.U) in which density is more in the incisor areas and canine areas compared to the premolar and molar regions. Variation in the bone mineral density was found to be statistically highly significant.
The bone patterns in the maxilla comprises of fine trabeculae arranged in a lace like pattern. The trabecular arrangement produces smaller marrow spaces than seen in the mandible (of same person). The finer network of trabeculae (mesh) may vary from 1 mm to 3-4 mm. as a person grows older the bone loses some of its calcific content for various reasons: nutrition, atrophy, hormonal change, osteoporosis, etc.[4]
The study shows the bone mineral density is almost from incisor areas to molar areas in the buccal cortex andthe bone mineral density may lie on nearly the same level over the entire palatal cortex. In the trabecular region bone mineral density is more in the incisor and canine areas compared to the premolar and molar areas. The bone mineral density in males is little higher than females, but implant therapy can be carried out with same degree of success.
This study also shows an insight into variable bone mineral density in anterior and posterior region maxilla. The higher bone mineral density in the anterior region of maxilla may be one of the reasons for increased success rate in osseointegration. Computed tomography is mandatory in prospective implant patient not only in assessing bone mineral density but also the height and width of the available bone.
Conclusion
1. Computed tomography provides both quantitative and qualitative information of trabecular and cortical bone separately, thus aiding in proper patient selection and facilitate proper assessment of potential recipient sites for implant placement.
2. The bone mineral density in incisor, canine, premolar and molar areas in the trabecular region of maxilla in the males and female subjects there is highly significant variation from incisor areas to molar areas.
References
1. Lindh C, Nilsson M, Linge BK, Petersson A. Quantitative computed tomography of trabecular bone in the mandible. Dentmaxillofac Radiol 1996; 25:146-50.
2. Brånemark P-I, Breine U, Adell R, Hansson BO, Lindström J, Ohlsson Å: Intra-osseous anchorage of dental prostheses. I. Experimental Studies. Scand J Plast Reconstr Surg 1969; 3:81-100.
3. Taguchi A, Tanimoto K , Akagawa Y, Suei Y, Wade T, Rohlin M. Trabecular bone pattern of the mandible comparison of panaromic radiography with computed tomography. Dentomaxillofac Radiol 1997; 26:85-9.
4. Internet reviews: introductiontoradiologicinterpretation.htm.
5. Blomberg S, Lindquist LW: Psychological reactions to edentulousness and treatment with jawbone-anchored bridges. Acta Psychiatr Scand 1983; 68:251-62.
6. Misch CE. Contemporary implant dentistry. St Louis. Mosby 1999
7. Wyatt CCL, Pharoh MJ. Imaging techniques and image interpretation for dental implant treatment. Int J Prosthodontics 1998; 11:442-52.
8. Andersen L, Kurol M. CT scan prior to installation of osseointegrated implants in the maxilla. Int J Oral Maxillofac Surg 1987; 16:50-5.
9. Zarb GA, Schmitt A. The edentulous predicament I - A prospective study of effectiveness of implant supported fixed prosthesis. JADA 1996; 127:59-65.
10. Garg AK, Winkler S, Bakaeen LG, Mekayarajjananonth T. Dental implants and the geriatric patient. Implant Dent 1997; 1:168-73.
|