Introduction
Aesthetically, the midline is the most important crucial spot in a smile. Esthetics in dentistry has become a major concern for patients and often serves as a predominant reason for seeking dental care. Although perfect bilateral symmetry will not exist in living organisms, it is one of the most important factors in defining the attractiveness of a smile. A properly placed midline contributes to the desirable effect of balance and harmony of the dental composition[1].
Towards the end of 19th century, several attempts have been made to find and correlate quantitatively the facial midline(FM) and skeletal midline(SM), with the help of landmarks which fall in the middle of the facial and skeletal images and correlating these midline landmarks with the dental midline(DM) to find the amount of deviation through both the photographic and radiographic forms respectively
Lundstrom(1961) in his study on the asymmetries in the dental arches and face, explained that asymmetric can be genetic or non genetic in origin and is usually a combination of both[2]. Golub (1988) reported that the DM perpendicular to the interpupillary line offers one of the most striking contrasts serving to anchor the smile of the face[3].
Avinash Bindra et al in the year 2009 has conducted a study on the relationship of the facial anatomic landmarks with the midline of the face and mouth, stated the hierarchy of anatomic landmarks closest to the midline of the face are i) Midline of the commissure, ii) DM iii) Tip of the philtrum iv) Nasion and v) Tip of the nose[4].
DM is the imaginary line that will separate the two maxillary central incisors. Dental authors who have addressed themselves to this matter revealed a division of thought: One school of thought recommends that the midline of the anterior teeth to be placed precisely in the facial median line or the middle of the mouth using such landmarks as the incisive papilla and the labial frenum to establish it. Members of another school believe that the DM should almost never be established in the precise middle of the mouth because to do so contributes to an artificial appearance[5].
Aims & Objectives
The present clinical study has been conducted to evaluate the following criteria.
1. Examining and evaluating the amount of FM deviation to the DM through photographs.
2. Examining and evaluating the amount of SM deviation to the DM through radiographs.
3. Examining and evaluating both the FM and SM deviations simultaneously by Adobe Photoshop software.
Materials & Methods
Following list of materials were used for the study
1. List of materials used for examination of the subjects.
a) Mouth mirror
b) Explorer
c) Periodontal probe [Graduated]
2. List of materials used for taking photographs of the sample
a) Nikon D3000 SLR camera.
b) Tripod tron tpt-30.
c) Surgical Spirit.
d) X ray viewer.
e) Frontal cephalogram of skull radiographs of the sample.
f) Panoramic x ray unit
g) Manual set-up simulating the parallelism of the ala-tragus line of the subject to the floor.
3. Materials used for editing the photographs
a) Laptop – Acer 4720Z
b) Adobe Photoshop CS2 Version 9
c) Paint shop Pro version.
For the present study the sample size of fifty (50) has been taken of which the male and female subject are proportional in quantity
Study Was Carried Out In The Following Manner
1. Selection of subjects was done.
2. Frontal cephalograms of subjects were taken.
3. Photographs of frontal cephalograms of the skull were taken.
4. Photograph of the subjects were taken.
5. Amount of midline deviation of the facial photographs of the sample were noted.
6. Amount of midline deviation of the frontal cephalogram of the skull of the same sample were noted.
7. With the help of digital photographic software, the digital images of the frontal cephalograms and the respective facial images were overlapped and the sides of the deviations were determined.
Criteria For Selection Of Subjects
Exclusion Criteria
1. Subjects having gross facial asymmetry due to trauma or congenital conditions.
2. Subjects with history of trauma to the head and neck.
3. Subjects underwent orthodontic, endodontic, periodontic and prosthodontic treatment.
4. Subjects having attrition, erosion and abrasions of the anterior teeth.
5. Subjects with crowding, overlapping, tipping, spacing(including diastemas), retained deciduous teeth and rotations of anterior teeth.
6. Subjects with congenital defects of lips or anterior maxillae or who had corrective oral surgery of the region.
7. Images with rotations of head around the vertical axis, ophthalmic asymmetries, inaccurate clinical markings and images without a good resolution.
Inclusion Criteria
1. The randomized sample obtained from the people who have hailed from different places of this state to Government Dental College & Hospital, Hyderabad.
2. The sample had permanent teeth with no history of extraction for orthodontic treatment or any other reason.
3. All the teeth were morphologically normal.
4. No gingival inflammation or hypertrophy present.
5. Subjects with average smile line revealing 75-100% of the maxillary anterior teeth
Methodology
Determination Of Sample Size
As an initial step, a pilot study was conducted to calculate the sample size. For this purpose, five photographs of the frontal view of the face and frontal view of the skull were analyzed and based on the measurement obtained the calculations were established. With the help of the software “Adobe Photoshop CS2 Version 9” and with statistical significance of 95% and power 90%, the sample size indicator formula is applied and the sample size (N) of fifty (50) is established. The randomized samples of both the genders of equal quantity (Male=25: Female=25) participated in the study with age ranged from 18 years to 30 years with a mean age of 24years.
The study was carried out in three parts, first part includes the determination of SM deviation to the DM, the second part includes the determination of FM deviation to the DM and the third part includes the amount of facial and SM deviation in the overlapped images of photograph and the cephalogram.
Sm Of The Skull
The horizontal reference line was defined as the line connecting the right and left latero-orbitales[6]. The line perpendicular to the horizontal reference line passing through the crista galli and the anterior nasal spine was considered as vertical reference line. This vertical reference line should bisect the nasal septum, anterior nasal spine, glabella, maxillary and mandibular midlines and the menton[7].
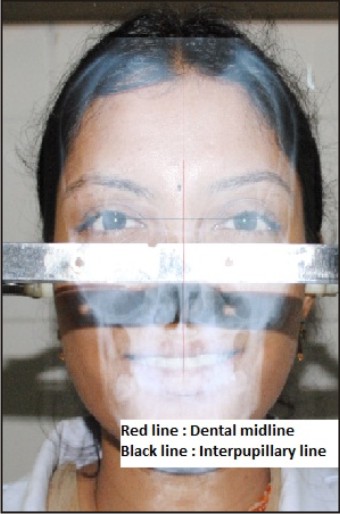
Soft-tissue(Facial) Midline Of The Face
The FM is defined as the perpendicular bisector of the line between the centers of the left and right pupils[8],[9],[10].
Obtaining The Extra Oral Radiograph
The frontal cephalogram of the skull(PA view) has been taken using the panoramic X ray machine (PLANMECA, PLANMECA EC PANAROMIC x ray unit, Version 12 software PK 15, Helsinki, Finland). Frontal cephalograms were taken with 70Kv, 12mA and 1.2seconds in postero-anterior (PA) projections with a distance of 180cm between the x ray focus and the film[11]. The postero-anterior cephalograms were printed on a film at 1.08 magnifications on 8X10 inch films. A frontal cephalogram (PA) was obtained with each subject in centric occlusion. The subjects head position is standardized by positioning cones so that the ends of the ear posts are level with the external auditory meatus. Position the subject between the two ear posts. Adjust the tilt of the patients so that the Frankfurt plane is parallel to the floor (tragus to the infra orbital margin)[12].
The frontal cephalogram of the skull of the sample has been taken. The frontal cephalogram of the skull shows distinguishable midline landmarks which are symmetrical and stable. The landmarks are glabella, anterior nasal spine, menton and the base of the crista galli[13]. The other landmarks which are readily identifiable are lateral borders of the orbits, the point gonion, the anterior cranial base and the lesser wing of sphenoid.
Obtaining The Photograph Of Subjects
Full face images of the subjects were made in a frontal view with all subjects in smiling position. A specially designed device resembling a face bow mounted on a stand (Fig.1) was used to standardize the photographic conditions. Each subject was seated in a dental chair with the natural head position and the occlusal plane of the maxillary teeth parallel to the floor[14]. The stabilizer was adjusted to the subject by fitting the ear pieces into the external auditory canals. In addition, a third point of reference has been taken at the infraorbital margin, parallel to the floor. The photographs were made with a constant focal distance and under a standard light source using the Nikon D3000 SLR digital camera (10.1megapixels, 10X optical zoom: Nikon USA, Melville, NY). The height of the lens of the camera was adjusted on the tripod to match the eye level of the subject when seated upright with shoulders and head held straight and facing forward[15]. As the subject looked straight ahead at the lens of the camera on a tripod, the natural head position was standardized along both horizontal and vertical axes. The photographs thus obtained are stored in the JPEG format in the computer.
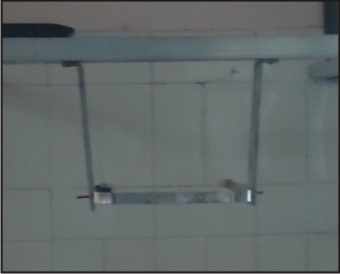 | Figure : 1
 |
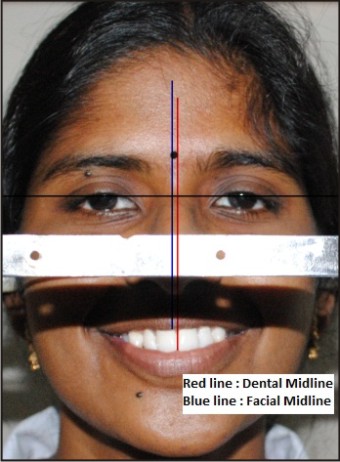
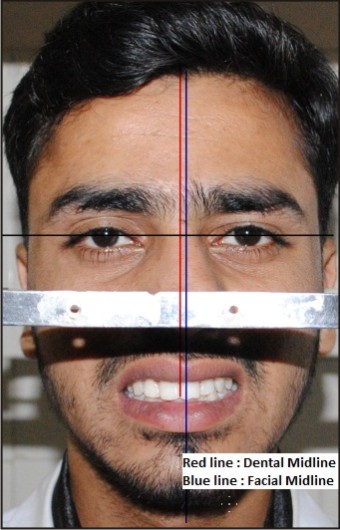
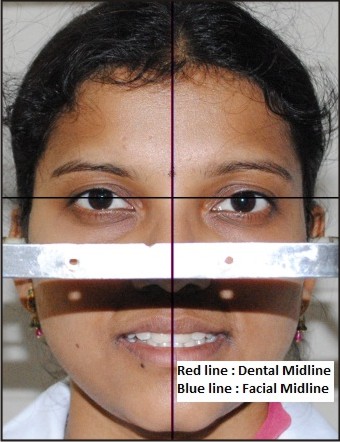
Amount Of Fm Deviation-photometric Evaluation
After obtaining the standardized full face photographs of the subjects. With the help of Adobe Photoshop CS2 version, tracing of the photographs are done. The center of the pupils of both eyes is joined and the line thus obtained is referred as horizontal reference line. The center of philtrum is taken as another reliable midline landmark and used to draw a line perpendicular to the horizontal reference line. This perpendicular line is referred as midsagittal reference line. Another perpendicular line is drawn taking the middle of both the maxillary central incisors to the horizontal reference line[9]. This line is referred to as DM and is in parallel to the midsagittal reference line. The amount of deviation (mm) is noted from the mid-sagittal reference line to the DM (Fig.2).
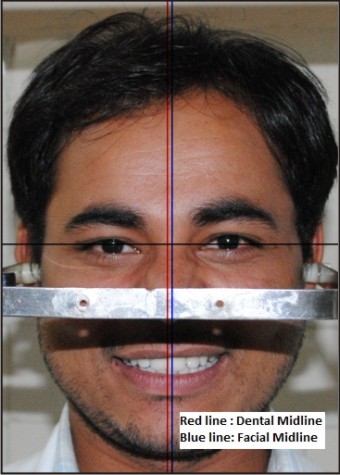 | Figure : 2
|
Amount Of Sm Deviation-radiographic Evaluation
After obtaining the standardized frontal cephalograms of the skull photographs of the subjects, maintaining the same focal length distance as that taken for the facial photographs. Tracings of the photographs are done using the Adobe Photoshop CS2 software. The superior lateral orbits of both the contralateral sides are reliable landmarks and the horizontal line passing through both these points are referred as horizontal reference line[6]. The base of the crista galli and the anterior nasal spine are two midline landmarks through which the vertical line passes is referred as vertical reference line[7], which bisects the horizontal line. This vertical reference line is the SM of the skull. Another vertical line drawn parallel to the SM which bisects the median line of both central incisors and is also perpendicular to the horizontal reference line. With the help of the ruler in the Adobe Photoshop(CS2 version), the amount of deviation in mm is noted (Fig.3). The data thus obtained are recorded for all the subjects.
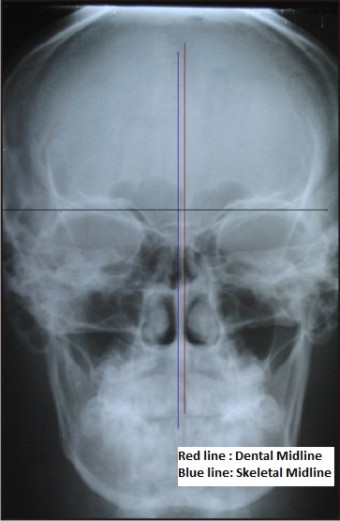 | Figure : 3
|
Assessment Of Deviation Side Of Overlapped Photographic Images Of Face And Related Radiograph.
With the help of the Adobe Photoshop CS2 version, the digital images of both the face form and the radiograph are taken and are overlapped. The overlapping of the images is done in such a way that the DM of both images of the same subject is coincided. The overlapped images are made LIFE-LIKE size while maintaining the fixed aspect ratio (Fig.4). Thus, the side of deviation of the subjects is recorded, whether the deviation side is on the same side or on the contralateral side of the DM is established.
 | Figure : 4
|
Results & Discussion
The present study was aimed to examine and correlate the amount of FM deviation and SM deviation to the DM by photometric and radiographic analysis in both male and female samples. The FM, SM and the DM were taken as the basic criteria for the present study. Accordingly the subjects were selected and their photographs with smiling face forms and also the photographs of the frontal view of the skull radiographs were evaluated digitally.
Results thus obtained were tabulated and statistically compared by Paired T-Test and also by Chi- Square Test.
Table 1 : The amount of deviation in x rays ranges from 0mm to 3.5mm, with maximum of 26% of sample showed deviation of 1mm followed by 20% of the sample showing 0.5mm deviation and with minimum of 3.5mm and 3.0mm of deviation is shown by 2% of the sample size.
Table 2 : The amount of deviation in photograph ranges from 0-2mm (in the sample), with maximum of 36% of sample showing deviation of 0.5mm followed by 1mm of deviation in 20% sample and with minimum sample size of 2% showing 2mm of deviation.
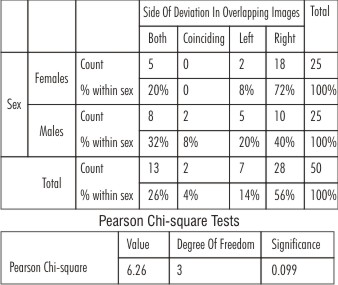
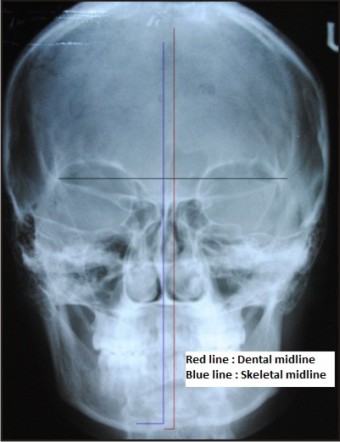
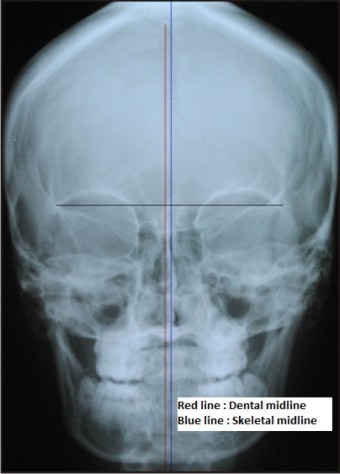
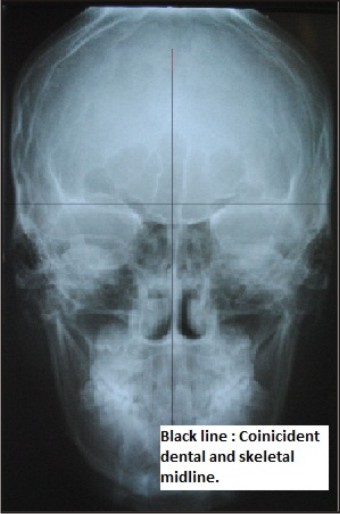
Table 3 : The images show right side deviation (Fig.5) in 56% of the sample size followed by deviation on both sides in 26% of sample size followed by left side deviation (Fig.6) in 14% of sample size and coincidence of both SM and FM to the DM in 4% sample (Fig.7).
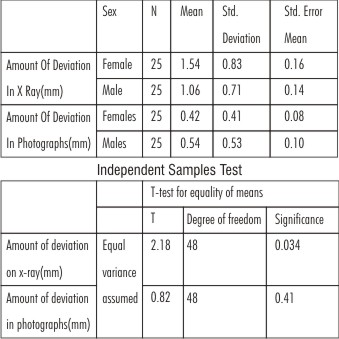
Table 4 : The statistical T-test with equal variance shows the skeletal deviation in X-ray has t=2.18 and for the deviation in photograph t=0.08. The ratio of mean values in skeletal deviation for females:males is 1.54:1.06 and ratio of mean values for females : males is 0.42 : 0.54.
Table 5 : The Pearson Chi- Square test in overlapping images show that the right side deviation is more(56% sample) followed by deviation both sides(26% sample) followed by left side deviation(14% sample) and shows a statistical significance value of 0.099.
Table 6 : Results showed that the Paired T test of the sample with mean of the amount of deviation in x rays shows 1.30 and that of the amount of deviation in photograph shows mean of 0.48. The paired samples test of both the amount of deviation in x ray and photographs shows mean of 0.82 and t value of 6.89 with degree of freedom of 49 shows statistical significant value of 0.01.
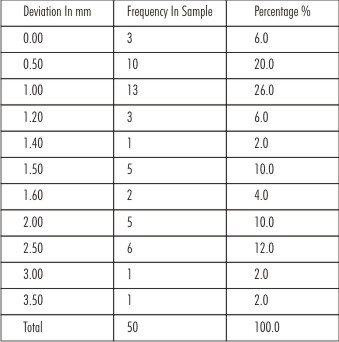 | Table 1 : Amount Of Skeletal Midline Deviation In X-ray
|
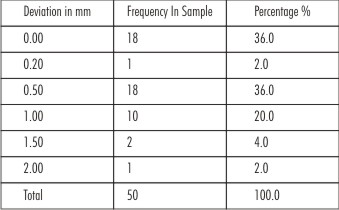 | Table 2 : Amount Of Facial Midline Deviation In Photograph.
|
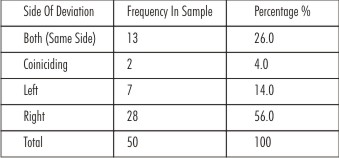 | Table 3 : Side Of Deviation In Overlapping Images.
|
 | Figure : 5
|
 | Figure : 6
|
 | Figure : 7
|
 | Table 4 : T-test For Determining The Amount Of Deviation In X-ray And Photograph Of Sample Group Statistics
|
 | Table 5 : Pearson Chi Square Test For Determining The Side Of Deviation Of Both Genders
|
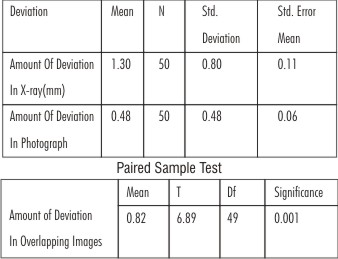 | Table 6 : Paired T-test For Determining The Amount Of Deviation In X-ray And The Photograph Of The Sample Paired Sample Statistics
|
 | Figure : 8
|
 | Figure : 9
|
 | Figure : 10
|
Conclusion
From the above study it can be concluded that no significant correlation exist between the amount of FM deviation to DM and the amount of SM deviation to DM but when the both the facial and skeletal images are overlapped the results obtained are statistically significant in determining the sidedness of deviation in females and males proper.
Among female and male subjects, males showed the greater percentage in the amount the FM deviation and SM deviation than the females, whereas the coincidence of FMs and SMs in males and females are similar in percentage.
Based on the above results, the dentist can clinically arrive at certain conclusions. Although this method involves high technology, it may improve the accuracy of determining FM and its correlation in placing the DM in edentulous and partially edentulous patients. Other factors should also be evaluated along with face form, selection of teeth in order to achieve aesthetically pleasing result. As no universally accepted method for determining the DM is established, dentist must seek guidance from a variety of techniques using their clinical experience and esthetic sense to attain what is hoped will be an acceptable result.
References
1. Jennifer L. Thomas, Catherine Hayes, Samer Zawaideh. “The effect of Axial midline Angulation on Dental Esthetics”. Angle Orthodontist 2003;73(4):359-364.
2. Anders Lundstrom. “Some asymmetries of the dental arches, jaws, and skull, and their etiological significance”. American Journal of Orthodontics 1961;47(2):81-106.
3. Golub J.Entire smile pivotal to tooth design ClinDent 1988;33:27–33.
4. Avinash S. Bindra, Thomas D. Taylor, John R. Agar, Patchnee Rungruanganunt, William P. Neace. “The Relationship of Facial Anatomic Landmarks with Midlines of the Face and Mouth. The Journal of Prosthetic Dentistry 2009:102: 94-103.
5. Ernest. L. Miller, W. Rupert Bodden and Homer. C. Jamison. “A Study of the Relationship of the Dental Midline to the Facial Median Line”. The Journal of Prosthetic Dentistry 1979;41(6):657-60.
6. Enkhtuvshin Gereltzul, Yoshiyuki Baba,Kimie Ohyama. “Attitude of the Canine in secondary Bone-Grafted and Nongrafted Patients With Cleft Lip and Palate”. Cleft Palate–Craniofacial Journal, 2005;42(6): 679-686.
7. Sheldon Peck, Leena Peck, Matti Kataja. “Skeletal asymmetry in esthetically pleasing faces.” The Angle Orthodontist 1991;61(1):43-47.
8. Evania Eskelsen, Camila Borges Fernandes, Fernanda Pelogia et al. “Concurrence between the maxillary midline and bisector to the interpupillary line”. Journal of Esthetic and Restorative Dentistry 2009;21(1):37-42.
9. Laurance Jerrold, Jeffrey Lowenstein, Massapeque. “The Midline: Diagnosis and Treatment”. American Journal of orthodontics and Dentofacial Orthopaedics 1990;97:453-62.
10. Samir E. Bishara, Paul S. Burkey, John G. Kharouf. “Dental and Facial Asymmetries: A Review”. Angle Orthodontics 1994;2:89-98.
11. Gerald M. Letzer, Joseph H. Kronman. “A Posteroanterior Cephalometric Evaluation of Craniofacial Asymmetry”. The Angle Orthodontics 1967;37:205-11.
12. Joseph Ghafari, Paul E. Cater, Frances S. Shofer. “Effect of Film Object Distance on Posteroanterior Cephalometric Measurements ”. American Journal of Orthodontics and Dentofacial Orthopaedics 1985; 108:30-7.
13. Duane C. Grummons, Martin A. Kappeyne Van De Copelle. “A Frontal Aymmetry Analysis”. Journal of Clinical Orthodontics 1987;21:448-465.
14. Nicholas S Davis. “Smile Design”. The Dental Clinics of North America 2007;51:299-318.
15. Antony H. L. Tjan, Gary D. Miller, Josephine G.P. “Some Esthetic Factors in a Smile”. The Journal of Prosthetic Dentistry 1984;51(4):24-28.
|