Introduction
E fforts to reduce pathological problems associated with orthodontic treatment have been a challenge to orthodontists. Technological advancements in the areas of resins, orthodontic brackets and auxiliaries have helped the orthodontist to reduce damage to the teeth and the periodontium. Enamel damage during debonding is a clinical problem that is encountered in orthodontic practice, for which a solution is still being sought. To keep iatrogenic problems to a minimum, authors and manufacturers of dental products have suggested various debonding techniques.
In vitro and in vivo studies have grossly varied in their suggestions for the best method of debonding. This is because no currently used testing techniques can adequately quantify fracture mechanic principles. But, the extension of the Finite Element Analysis Method (FEM) from structural engineering science to the biomechanical area has helped the orthodontic researcher in assessing variables in debonding with the percentage of accuracy considerably better than other methods[1].
Finite Element Analysis is a numerical method of structural analysis based on the principal of dividing the structure into a finite number of small elements that are connected with each other at the corner points of nodes. For each element, its mechanical behaviour can be written as a function of the displacements of the nodes. These nodes are submitted to certain loading conditions resulting in behaviour of the model similar to the structure that it represents when a computer analysis is performed. A system of simultaneous equations can be solved to relate all forces and displacements at the nodes. From this, the stress and strain contour can be established in each element and thus the whole body.
The present study was designed to:
1. Identity the types of stresses exerted on the adhesive and enamel during debonding with various types of forces.
2. Suggest the best debonding technique.
3. Generate a computer model for testing bonding and debonding procedures in the laboratory.
Materials & Methods
Tooth
The tooth chosen for this in vitro study was a maxillary first premolar because of the ease of availability of this tooth through therapeutic extractions if a true model study is to be carried out in the future.
The root of the maxillary first premolar was embedded in an acrylic block as shown in (Fig.1) and placed in a computerized tomogram (CT Scan). A series of CT Scans (Fig. 2) of sections 1mm in thickness in the mesiodistal and buccolingual directions were taken.
The tomograph sections were traced. An average buccal tooth curvature was added. They were digitized using the AUTOCAD and MECHANICAL DESK TOP SOFTWARE to get the X, Y and Z coordinates. The three dimensional model was generated using the ANSYS software. (Fig. 3).
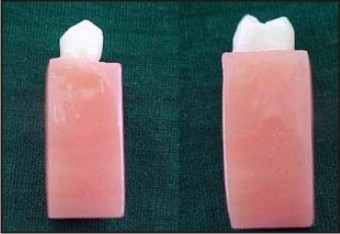 | Fig 1 : First Upper Pre Molar In Acrylic Block
 |
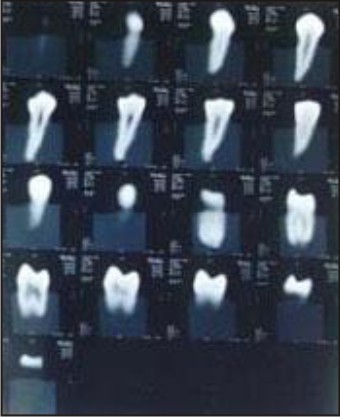 | Fig 2 : CT Scan Of First Upper Premolar
|
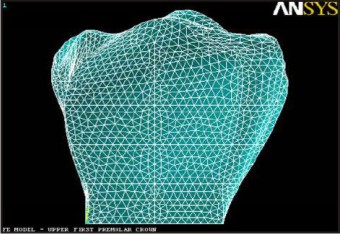 | Fig 3 : Finite Model
|
Adhesives
The adhesives chosen for this study were:
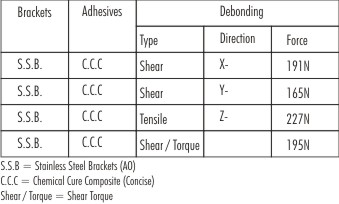
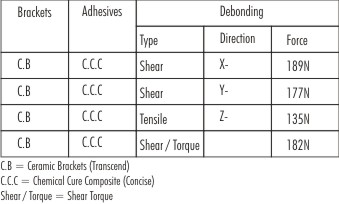
1. Chemical Cure Composite (Concise)
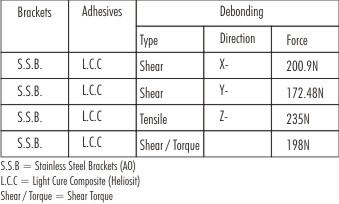
2. Light Cure Composite (Heliosit)
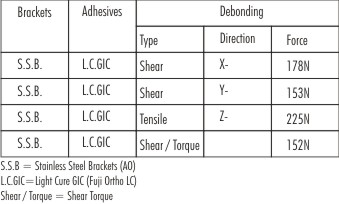
3. Light Cure GIC (Fuji ortho LC)
In accordance with Ellidas et al[2] the average thickness of the adhesive were taken as follows
1. Metal Bracket + Heliosit (L.C.C) : ® 200mm
2. Metal Bracket + Concise (C.C.C) : ® 200mm
3. Metal Bracket + Fuji Ortho LC (L.C.GIC) : ® 200mm
4. Ceramic Bracket + Heliosit (L.C.C) : ® 200mm
5. Ceramic Bracket + Concise (C.C.C) : ® 200mm
6. Ceramic Bracket + Fuji ortho LC (L.C.GIC) : ® 200mm
Brackets
The Brackets chosen for this study were
1. Metal Brackets (AMERICAN ORTHODONTICS)
2. Ceramic Brackets (Transcend – 3M/Unitek)
The mesiodistal, occlusogingival and base thickness of metal and ceramic brackets were measured using vernier calipers and the average bracket model was made without incorporating slot and wings. For this study only the crown portion of the maxillary first premolar was taken and only the buccal cusp was modeled.
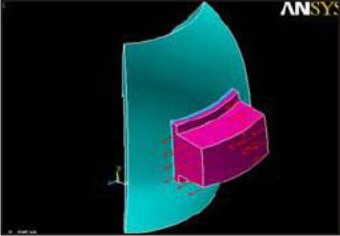
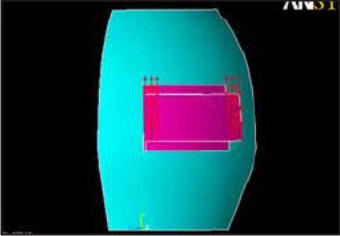
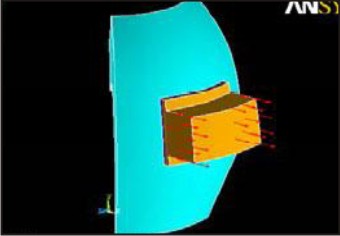
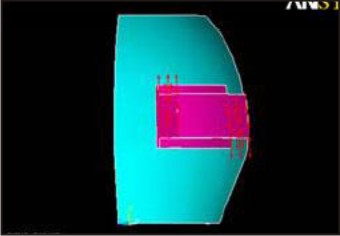
Now, adhesive and the bracket were added to the tooth model on the buccal surface in the centre of the crown, material properties as stated in Table – 1 were added to the model. Then, the tooth was again meshed from Dentin to the bracket. Now, this structure contains 3809 elements and 926 nodes. (Fig.4, 5, 6, 7).
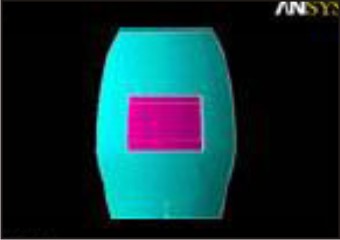 | Fig 4
|
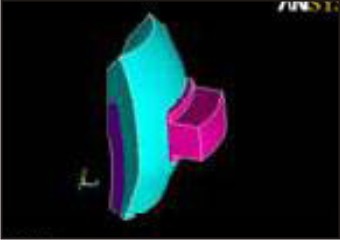 | Fig 5
|
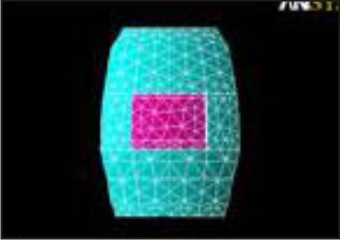 | Fig 6
|
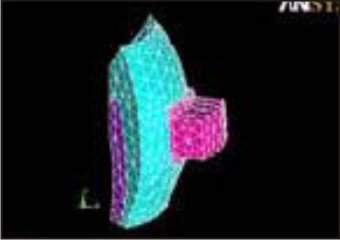 | Fig 7
|
The directions selected for loading in our finite element analysis were
1. Shear in X direction (Fig.8)
2. Shear in Y direction (Fig.9)
3. Shear in Z direction (Tensile) (Fig.10)
4. Shear torque (Fig.11)
 | Fig 8
|
 | Fig 9
|
 | Fig 10
|
 | Fig 11
|
The loading was applied on the mesial and distal sides of the bracket system in an ascending order from 1 Newton per node increased to the point of detachment. The force is distributed throughout the entire mesial and distal sides. The total nodes under load were 30 (15 mesial + 15 distal).
Statistics
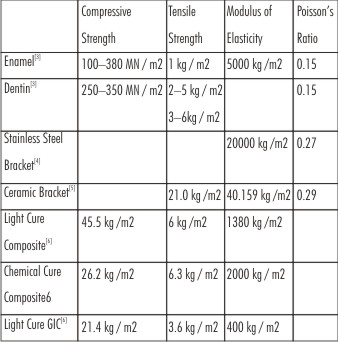 | Material Properties Used In The Study
|
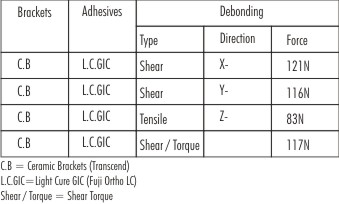
Results:
The amount of force required to Debond each bracket bonded with different adhesives was as follows.
Various debonding forces produced various types of stresses in the adhesive and on the enamel surface. Each type of stress was indicated by a different colour, each which is as follows.
In the adhesive:
a. The red colour shows – Maximum tensile stress areas.
b. The blue colour shows – Maximum compression areas.
On the enamel:
a. The red colour shows – Maximum tensile stress areas.
b. The blue colour shows – Maximum compression areas.
Discussion
1. The enamel damage for the stainless steel bracket with chemical cure composite (concise) was the least when a peel force was used in the Y. direction but the maximum in tensile debonding mode.
2. The enamel damage for the stainless steel bracket with light cure composite (Heliosit) was the least when a shear force was used in the Y direction but the maximum in tensile (shear – Z – direction) debonding mode.
3. The enamel damage for the stainless steel bracket with light cure GIC (Fuji ortho LC) was the least when a shear force used in Y – direction but the maximum in tensile (shear – Z) debonding mode.
4. The enamel damage for the ceramic bracket with chemical cure composite (concise) was the least when a shear force was used in Y – direction but the maximum in tensile debonding mode.
5. The enamel damage for the ceramic bracket with light cure composite (Heliosit) was the least when a shear force was used in Y – direction but the maximum in tensile debonding mode.
6. The enamel damage for the ceramic bracket with light cure GIC (Fuji Ortho LC) was the least when a shear force was used in Y-direction but the maximum in tensile debonding mode.
Y Shear was found to cause the least damage to the enamel. Support and confirmation of these computer-simulated findings can be done on extracted premolars with scanning electron microscopic studies, which may prove very beneficial to orthodontists.
References
1. R.G. Oliver. Effects of bracket removal on amount of residual adhesive. AJO- DO 1998 Mar; 196-200.
2. Eliadas, Viazis and Eliade. Bonding of ceramic brackets to enamel. AJO-DO- 1991 Apr; 369-375.
3. Combe EC. Notes on dental materials 6th edition.
4. Joseph V.S., Rossouw – AJO 1990, Feb
5. Michel L. Swartz. Ceramic brackets. AJO 1988 Feb.
6. Sturdevant John R. The art and science of operative dentistry 3rd edition. 259 & 266.
|