Introduction
Dentist cannot repair, remove or move teeth without being involved in occlusion. Normal occlusion means bilateral simultaneous tooth contacts[1] Occlusal contacts of opposing teeth are of immense importance as there are very few dental restorative procedures that do not involve the occlusal surfaces of teeth.
Good Occlusal practice involves a proper analysis of the occlusion which means defining those contacts between the teeth when the mandible is closed and stationary as the static occlusion and those contacts when the mandible is moving relative to the maxilla as in the dynamic occlusion[1],[3].
Proper Occlusal analysis requires few tools used to locate and define occlusal contacts these are called the occlusal indicators[2]. The sensitivity and reliability of techniques currently used depend upon the thickness, strength and elasticity of the recording material as well as the oral environment and clinician’s interpretation[4]. Both qualitative and quantitative methods are used for evaluation of occlusal relationships .With qualitative methods[5] only localization of the occlusal contact points can be determined ,the sequence and density of contacts cannot be evaluated .Wax, articulating papers, foils and even silk strips have been used for qualitative analysis . Articulating papers mostly used had disadvantage of being easily ruined by saliva, being thick and have a relatively inflexible base material, all of these factors results in a greater number of pseudo- contacts and smudging of contacts. Foils[6] are the thinnest indicator material; they give more accurate results than paper or silk .Foils produces the highest sensitivity values compared to other recording materials. However greater pressure must be applied when using foils because their marking capacity is less evident, under reduced pressure and on glossy surfaces. Silk strips are the best material for indicating occlusal contacts and do not produce pseudo contact markings because of their texture. But even they can lose marking abilities when their stain components are dried, and also can be ruined by saliva.
All these materials and methods require the dentist to make complex subjective decision about dental occlusion from inadequate and often confusing information.
Moreover while the importance of timing of occlusion is implicit is important in definition of normal occlusion, no existing methods employed time as a diagnostic parameter. In an effort to address all these deficiencies Tekscan's Dental Division was founded in 1989 with the development of grid-based sensor technology and the introduction of the T-Scan occlusal analysis system by Maness. The device enables the dentist to interpret occlusal contact information quantitatively by differentiating the sequence and density of contacts, using time as primary diagnostic variable. It offers a benefit of providing sequential order of individual occlusal surfaces coming into contact with relative force of one contact to another, and thus is a proven way to obtain timing and force of occlusal contact. In 1997, the T-Scan was further refined and the T-Scan vastly improved to T scan II . Now, progressive dentists all over the world are reaping the benefits of the latest technological advance in computerized occlusal imaging, the T-Scan II .
So the purpose of this paper is to discuss the various aspect of currently available computerized occlusal analyzer, T-Scan II for quantitative occlusal analysis.
System Description
The T-Scan system is composed of a sensor, cable, system unit, and software[7] (Fig 1).
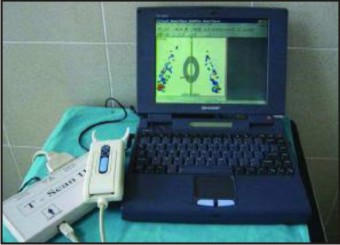 | Fig 1 : T - Scan II System.
 |
Sensor
The most important element of the T-Scan system is the disposable sensor, shown schematically in (Fig 2a). This Sensor is less than 60 um thick consisting of several layers of electrically conductive inks on a polyester film substrate. The top and bottom surfaces of the sensor are printed with thin conductive stripes which form an x-y grid of more than 1,500 sensing points.
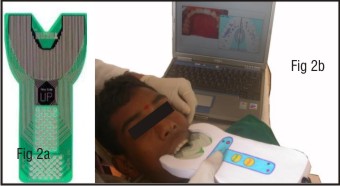 | Fig 2a : Ultra thin sensors, Fig 2b : Patient biting on the sensor which is placed inside the slot in handle with the monitor displaying occlusal contact points.
|
The accuracy of Tekscan’s sensors has greatly improved over time Originally the first generation of sensors (Blue color) were brittle, and tended to loose accuracy with age .Second generations (Green color) sensors had self life and maintained more flexibility with age .Third generations had no expiry date The latest generation of sensors can last indefinitely and with less inactive areas allowing for increase repeatability and accuracy.
Handle And Cable
The handle and cable (Fig 2b) assembly completes the electrical connection between the sensor and the system's central processing unit by inserting the sensor into a slot in handle bringing equivalent areas on the sensor and circuit board are in alignment, making electrical contact.
System Unit
The system unit contains the electronics forrecording, analyzing, and viewing occlusal data. It comprises four major subcomponents.
The sensor circuit that reads the status of each contact point on the sensor. It serially scans the entire sensor.
The computer motherboard houses the microprocessor, which coordinates all elements of the T-Scan. It incorporates the memory necessary for data storage as well as for storage of the software program.
The video monitor displays the occlusal data in easy- comprehend formats.
The Power Supplyhas been designed to meet the power requirements of the system.
Software
The sensor after being placed in the slot in the handle, the system is placed inside the patient’s mouth and patient is asked to perform various mandibular movements (Fig 2b), these movements are recorded and displayed on the monitor using software. Software forthe T-Scan has been developed to analyze and display occlusal contact information gathered by the sensor& has been regularly updated. The earlier software in T Scan I was based on DOS system and had five modes of operation the Real Time Display And Record Mode Movie ,The Balance Plot, The Time Display & The Comparison Screen[7]
The currently available software in T Scan II is a windows based software and has many more modes and software enhancements incorporated into it they are
Force plot
Locating Tooth Contacts -T-Scan II - Force Plot is graphical representation of locating tooth contacts .The T-Scan II represents tooth contacts as Force Concentration zones. These zones are color-coded graphical representations of the actual tooth contact, combined with a representation of the compression of the T-Scan II sensor by the approximation (not actual tooth contact) of the surrounding occlusal surface with the opposing occlusal surface (Fig 3). This sensor compression in these non-contact regions often results in areas of a Force Plot that contain low level (Blue/blue - green) forces (the compressed part of the sensor) that appear near the higher level forces (Red/yellow/green) illustrating the location of the actual tooth contact. Contained within each Force Concentration Zone is a range of colors that describe what types of relative forces are occurring within the actual tooth contact and those that are near to the actual contact points thus allowing the operator to determine non-uniform force regions of any dental arch.
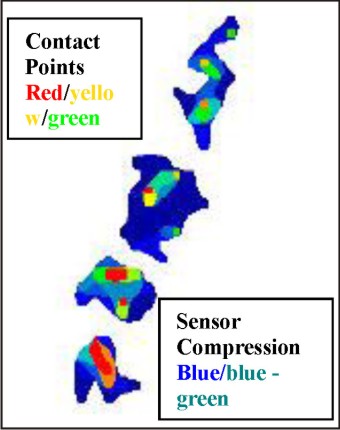 | Fig 3 : Tooth contacts seen as Force Concentration Zones.
|
The Sensitivity Adjustment
The Sensitivity Adjustment Software Tool accomplishes a proper force recording range matched to each patient individually in order to properly discern the differing occlusal forces within an arch of tooth contacts. Proper sensitivity adjustment settings ensure that the T-Scan II force recording range is matched to the “bite strength” of the individual patient. The T-Scan II software automatically adjusts the recording range to match that of the patient bite forces. It does this by analyzing an initial force movie recording of a patient making a full closure into Intercuspal Position. With the sensitivity properly adjusted to the “bite strength” of each patient during a given force movie recording, the relative forces within the various tooth contacts of a specific patient can be differentiated from each other.
Force legend tool
The Force Legend illustrates the color coding that describes 256 levels of force that can be recorded in a given Force Movie(Fig 4). The color-coding is applied through the range of forces that a patient may produce while closing through the T-Scan II sensor during a Force Movie recording. The variability between patient force ranges is automatically compensated for by the software Sensitivity Adjustment as described above ,while the system analyzes the patients’ initial closure forces. Thus With the sensitivity properly adjusted to the “bite strength” of each patient, during a given Force Movie recording, the relative forces contained within the various tooth contacts of a specific patient, can be differentiated from each other. The graphic display can then reproduce the 256 force gradations within each specific patients bite force range properly. The Sensitivity Adjustment affects the Graphic Display by establishing the correct recording range for each specific patient.
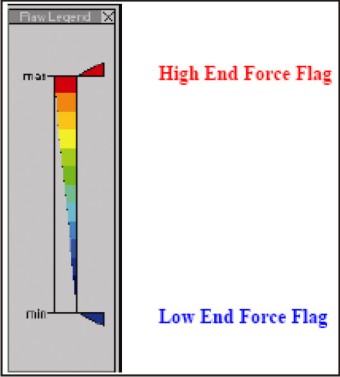 | Fig 4 : Force Legend with two force flags which can be raised or lowered.
|
Setting The Force Legend
Setting the Force Legend is a valuable operation which aids the operator in improving the graphical display of the Force Movie playback.
This is accomplished by either
a) Filtering out the sensor compression areas that surround the actual tooth contacts which is not truly tooth contact information. Sensor Compression is the light grazing of the teeth across the sensor surface as teeth approximate each other around the actual tooth contact area. This is helpful as it filters out the non contact areas from the play back of force movie so that actual contact points become easier to locate (Fig 5 & 6) This graphical display enhancement is achieved by using the mouse to raise the blue lower flag or by
b) Differentiating which similar color-coded Force Concentration Zones are more or less forceful relative to each other, this is achieved by lowering the red upper flag (Fig 7 & 8).
The degrees to which the flags are moved are assessed on per movie basis, determined by operator’s clinical judgments.
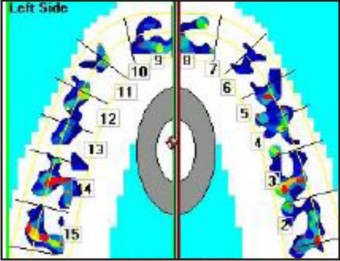 | Fig 5 : Force plot with blue flag of force legend bottomed out.
|
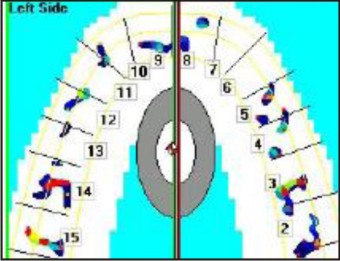 | Fig 6 : Force Plot with blue flag of force legend raised approx. 40%, Filtering sensor compression areas making plot more readable
|
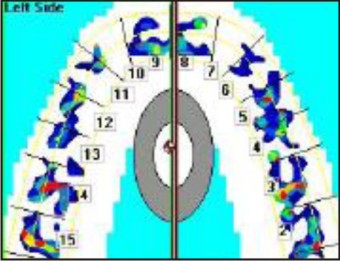 | Fig 7 : Force plot with red flag of force legend at top
|
 | Fig 8 : Force plot with red flag of force legend dragged down
|
Force vs. Time Graphing
Each recorded Force Movie is represented in graphical form that illustrates the force changes that occur over the entire time continuum of the movie.
Centre of force
It is a unique software feature of T-Scan II. It is the point at which all forces acting on a body or system may be considered to be concentrated. The Center of Force[8] (COF) is the balance point of the occlusal forces .Research has shown that a patient with "normal" occlusion shows the resultant forces from tooth contacts in the midline of the hard palette and centered in the second premolar first molar region. In the force plot when this software is activated a large gray and white ellipse in the midline of the hard palate represents this balanced, average force distribution and acts as a COF reference target. The patient's COF is represented by a small red icon (Fig 9). The closer the patient's COF icon is to the center of the gray ellipse, the more balanced the occlusal forces. By comparing the position of the patient's COF (red icon) in relation to normal force distribution (ellipse), a dentist can easily see how well-balanced the patient's occlusion is in respect to the reported normal population.
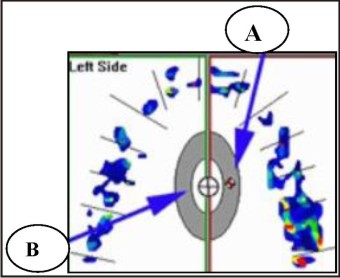 | Fig 9 : Arrow A- Red and white marker represents the centre of force , Arrow B Area where a well balanced centre of force should be.
|
Theory of Operation
When the patient occludes on the sensor the conductive ink particles come together in the force applied areas which increases the pressure leading to a decrease in its electrical resistance. The electronics scan the sensor, looking at each grid point to determine the resistance and thus the pressure points. The older T-Scan prototype utilized a single threshold value. Whereas the new generation records the magnitude of the pressure at each contact. Timing information is produced by controlling the start of each scan of the sensor. A real-time clock within the microprocessor circuit is set to interrupt the processor at regular intervals of l0 msec. Each time the processor is interrupted, it sends a signal to the sensor circuit to initiate another complete scan of the sensor. The processor then accepts data from the sensor circuit, stores it in memory, and waits for the next timer interrupt.T-Scan Force Plot.
Clinical Applications
The T Scan is potential clinical device to diagnose ,treat occlusion as it offers a greater variety and accuracy of Occlusal data and because it uses time as the diagnostic variable .It has application in Restorative procedures, fixed and partial prosthesis , implant prosthesis , temporomandibular joint disorders , disclusion time reduction, abfraction management , periodontal management ,adhesive reconstruction ,orthodontics, locating painful tooth, diagnosis etc
Conclusion
Tek scan II system is a computerized device using time as a diagnostic variable to quantify occlusal contact information showing sequential order of individual Occlusal surfaces coming in contact with relative force to each other .It is an great tool for whenever information on Occlusal contacts is needed. Working under various operational modes , it gives dentist a greater ability to visualize, diagnose and treat complex disease of occlusion, assess clinical progress through easily retrievable Occlusal history in addition to providing accurate indicator for establishing occlusion harmony when placing a restoration . Thus being an integral part of clinical functional analyses in prosthetic and restorative insertions. The T-Scan II computerized system can quickly determine prematurities, high points, regions of excessive force and non uniform force concentration. It can also calculate disocclusion time accurately.
References
1. S. Davies, R.M.J Gray .What is occlusion .Br Dent J 2001;191;235-245.
2. Ahmet Saracoglu ,Birgul Ozpinar. In Vivo and in vitro evaluation of occlusal indicator sensitivity J Prosthet Dent 2002;88:522-26
3. S.J Davies ,R.M Gray ,P.W Smith .Good Occlusal practice in simple restorative dentistry Br Dent J 2001;191;365- 381.
4. Schelb E ,Kaiser D.A ,Brukl C.E Thickness and marking characteristics of Occlusal registration strips J Prosthet Dent1985;54:122-26 .
5 Dawson PE. Evaluation diagnosis and treatment of Occlusal problems 2nd ed. St. Louis:Mosby; 1989 : 448-56.
6. Reiber T, Fuhr K, Hartmann H ,Leicher D Recording the pattern of Occlusal indicators influence of indicator thickness, pressure and surface morphology .Dtsch Zahnarztl Z 1989;44:90-37.
7. William L. Maness ,Michael Benjamin ,Robert Podoloff et al. Computerized Occlusal analysis ; A new technology. Quintessence Int 1987;18:287-92.
8. Kerstein R.B Understanding & using centre of force, DentToday 1998; 17:116-19.
|