Introduction
Mixed dentition space analyses forms an essential part of diagnostic procedures. These analyses help to assess the amount of space required for the alignment of unerupted permanent teeth in a dental arch[1]. Inappropriate mixed dentition space analyses results could lead to extraction decisions that negatively alter a patient's soft tissue facial profile[2].The applicability of this method to populations of other ethnic groups has been studied and doubted[3], [4], [5], [6], [7]
So the purpose of this study is to formulate the new prediction aids (probability tables and prediction equations) that can enable a more accurate mixed dentition space analysis in Himachal population.
Materials and Method
This study was conducted in the Department of Orthodontics, Himachal Dental College, Sundernagar, H.P. Dental study casts of 100 male and 100 female subjects were selected for this study. The casts were made from dental impressions of children in various schools of Himachal Pradesh state in India, after approval was obtained from their parents and teachers. The criteria for sample selection were the following-
1. The mandibular permanent incisors, the mandibular and maxillary permanent canines, and the mandibular and maxillary premolars were fully erupted.
2. There was no obvious loss of tooth material mesiodistally as a result of caries, fractures, congenital defects, or interproximal attrition.
3. The dental impressions and study casts were high quality and free of distortions.
4. The subjects had no previous history of orthodontic treatment.
5. All subjects had a similar ethnic background.
The teeth measured were the mandibular central and lateral permanent incisors, the mandibular and maxillary permanent canines, and the first and second premolars of both arches. The values obtained for the right and left canine-premolar segments in each arch were averaged, so that there would be one value for the mandibular canine-premolar segment and one value for the maxillary canine-premolar segment for each value of the combined mandibular incisors.
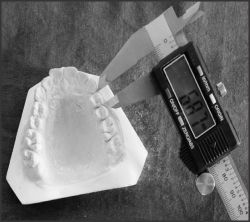
Measurements of the mesiodistal crown widths of the mandibular and maxillary teeth were made by using a digital caliper with a vernier scale, calibrated to the nearest 0.03 mm, the tips of the calipers were precision engineered to ensure the greatest accuracy while measuring the various tooth groups (Fig 1). A standardized method proposed by Moorrees and Reed[12] was used to
 | Fig 1: Vernier Callipers Used For Measuring The Mesiodistal-widths
 |
 | Fig2: Measuring The Mesiodistal Dimensions Of Teeth
|
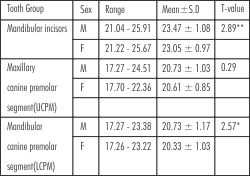 | Table I – Descriptive statistics for the combined mesio-distal width of the 3 tooth groups.
|
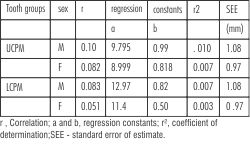 | Table II- Regression parameters for prediction of mesiodistal widths of canine-premolar segments
|
measure the mesiodistal crown widths. The greatest mesiodistal crown width of each tooth was measured between its contact points, with the sliding caliper placed parallel to the occlusal and vestibular surfaces (Fig 2). This method was reported to be highly repeatable and accurate for measuring mesiodistal crown widths by Doris et al[10].
Results
Descriptive statistics, including the mean, standard deviation,and minimum and maximum values were calculated. The coefficient of co-relation was calculated to find the co-relation between the sums of canine and premolars in both arches with that of sum of mandibular incisors (Table II). A student's unpaired t test was calculated to compare tooth dimensions between male and female subjects. It showed highly significant difference in mandibular group with males having larger teeth.
These data were then used to develop regression equations
Y= a+b(x)
a and b are regression co-efficient
Y = summed width of mandibular incisors
x = summed width of canine and premolars
Male: Maxilla- Y=9.79+0.99x
Mandible -Y=12.97+0.82x
Female: Maxilla- Y=8.99+0.81x
Mandible- Y =11.4+.50x
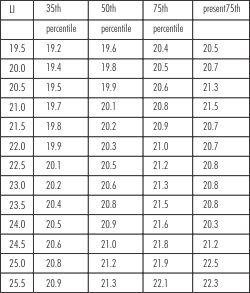
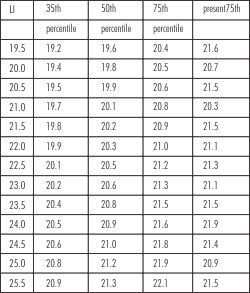
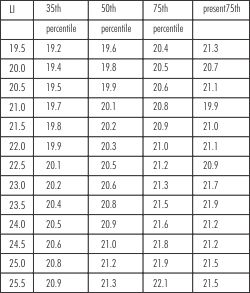
The co-efficient of determination r2 was calculated to determine the accuracy of the formulated regression equation. The standard error of estimate was calculated to determine the validity of the proposed equation and compared with reports of various investigators. This regression analysis was used to formulate new prediction equations that can be used clinically to predict the mesiodistal crown widths of the unerupted canine premolar segments (Y) when the combined mesiodistal crown widths of the 4 mandibular permanent incisors are known (X). The regression equations derived in this study were used to prepare new probability tables on the Moyer's pattern and are presented in Table III, Table IV and Table VIII.
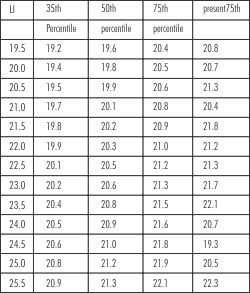 | Table III- Actual and Predicted values at 35th, 50th and 75thpercentile of Moyers chart for Males in the mandibular arch
|
 | Table IV- Actual and Predicted values at 35th, 50th and 75th percentile of Moyers chart for females in the mandibular arch
|
 | Table V- Actual and Predicted values at 35th, 50th and 75th percentile of Moyers chart for Males in the maxillary arch
|
 | Table VI- Actual and Predicted values at 35th, 50th and 75th percentile of Moyers chart for Females in the maxillary arch
|
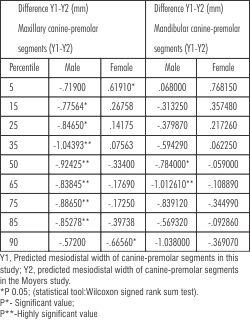 | Table VII. Differences between the regression values of this study and those in the Moyers probability tables at various percentile levels
|
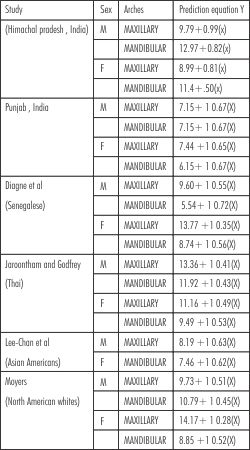 | Table VIII : Prediction equations from various studies at the 50th percentile
|
Discussion
The size of the teeth is related to genetics (e.g., gender and ethnicity) and environment. There are definite racial and ethnic differences evident with regard to tooth size[5],[9], [10], [11], [12], [13], [14], [15] and this is clearly reflected by the differences seen in the data from the regression equations between the present study and the data of Moyers[16].
Accurate treatment planning in management of mixed dentition cases is of great importance. But if predicted values of the width of the canines and premolars itself is wrong, the whole treatment may be a failure. A difference of 2mm per arch between the predicted width and the actual width is clinically significant as it effects extraction decision in patients with moderate crowding (4-7mm) in mixed dentition. Permanent teeth may be either inappropriately retained or extracted on the basis of such an inaccurate tooth width prediction and the whole treatment plan may be a failure.
The use of digital calipers with a standard error of +0.03 mm have been shown to be more accurate methods of measuring mesiodistal tooth dimension on dental study models. Hence, they were chosen for this study[17]. The excellent measurement accuracy reduced the possibility of introducing systemic and random errors in measurements.
Table I shows that the male subjects have statistically larger mesiodistal tooth dimension in the mandibular arch than the female subjects. The difference in the mesiodistal tooth dimension of the canines and premolars between both the genders in the maxillary arch is not statistically significant. Our results were similar to the study conducted by Schirmer[16], but many other authors do not differentiate the genders when predicting the mesiodistal diameter of these teeth [3],[5].
Table II shows males show the highest r2 (0.10) value for the maxillary buccal segment. This shows that the prediction equation of the maxillary arch for male subjects is more precise. Female subjects show the lowestr[2] (0.007) value for the maxillary buccalsegment. This shows that the prediction equation of the maxillary arch for female subjects is less precise. Jaroontham J et al[13] obtained lower r2 values (0.29 for maxillary teeth and 0.34 for mandibular teeth in males; 0.39 for maxillary teeth and 0.42 for mandibular arch in females). In another similar study conducted on subjects in Southern Thailand, r2 values were 0.46 and 0.47 for maxillary and mandibular teeth, respectively. The difference in the sets of r2 of these studies might be attributable to the effect of different sample sizes and the ethnic mixes.
The new mixed dentition prediction aids (regression equations and probability tables) developed in this study are presented in Tables III, Tables IV, Tables V, Tables VI and Tables VIII. The use of these prediction aids for estimation of unerupted canine premolar widths could result in a more accurate mixed dentition space analysis in Himachal population.
Significant differences (P 0.05) were found between the predicted mesiodistal tooth widths of our study and that of the Moyers probability tables at almost all percentile confidence levels (Table VII). It can be generally stated that the Moyers tables tend to underestimate the mesiodistal canine-premolar widths of this population group, including at the recommended 75% level. Probability tables on the Moyers pattern have also been derived by Priya and Munshi[14] (South Indians) and Schirmer[16] (black South Africans). Priya and Munshi[14] also concluded that the Moyers probability tables underestimated the tooth sizes of South Indian children. Schirmer[16] tested the applicability of the Moyers tables in black South Africans and found highly significant differences (P 0.001) at all percentile confidence levels, in the arches of both male and female subjects, except at the 75%, 85%, and 95% levels in the maxillary arch of females. Al-Khadra6 found that the recommended 75% confidence level of the Moyers probability tables overestimated the sizes of canines and premolars of a Saudi Arab population.
Moyers' mixed dentition analysis[18] is based on the correlation of tooth sizes between the sum of the mandibular permanent incisors and unerupted canines and premolars. Moyers recommended using the 75th percentile level of probability in his tables. In agreement with previous studies concluding that Moyers' regression equations are not an accurate method for the prediction of the size of unerupted permanent teeth in different populations [6],[13],[16]. Weshowed in this study that Moyers' tables cannot be used at the recommended 75% probability, since significant differences were observed for the actual widths of the canine and premolars segment and those predicted by Moyers' probability tables. Our results confirm that the Moyers probability tables underestimate tooth sizes of Himachal population. Developing new probability tables on the Moyers pattern, specifically for different population groups, can aid in achieving more accurate estimation of unerupted tooth sizes.
Conclusion
The following conclusions were drawn from this study -
1. There is statistically significant sexual dimorphism in tooth sizes in Himachal population, highlighting the importance of developing separate mixed dentition prediction aids for male and female patients.
2. Moyers prediction tables were not accurate when applied to our sample. The differences noted between predicted values of the Moyers tables and those of present investigation are the result of racial and ethnic diversity.
3. Moyers probability tables underestimate tooth sizes of Himachal population.
References
1. Ballard ML, and Wylie W. Mixed dentition case analysis estimating size of un-erupted permanent teeth. AmericanJournal of Orthodontics 1947; 33: 754-59.
2. Huckaba G.W. Arch size analysis and tooth size perdition. Dental Clinics of North America1964; 8: 431-440
3. Durgekar SG, Naik V. Evaluation of Moyers mixed dentition analysis in school children. Indian J Dent Res 2009; 20:26-30
4. Fonsenca CC. Predicting the mesio-distal crown width of the canine-premolar segment of maxillary dental arches. M.S. Thesis, University of Tennessee, School of Dentistry, Memphis, 1961.
5. Ferguson FS, Marco DJ, Sonnenburg EM and Shakun M.L. The use of regression constants in estimating tooth size in the Negro population.American Journalof Orthodontics1978; 73(1): 68-72.
6. Al-Khadra BH. Prediction of the size of un-erupted canines and premolars in a Saudi Arab population.American Journal of Orthodontics and DentofacialOrthopedics 1993; 104(4): 369-372.
7. Yuen KK, Tang EL and So LL. Mixed dentition analysis for Hong Kong Chinese.The Angle Orthodontist1998; 68(1): 21-28.
8. Smith HP, King DL and Valencia R. A comparison of three methods of mixed dentition analyses. The Journal ofPedodontics1979; 3(4): 291-302.
9. Moorrees CFA and Reed RB.Correlation among crown diameters of human teeth.Archives of OralBiology 1964; 9 : 685-697.
10. Doris JM, BernardBW, Kuftinec MM, Stom D.A biometric study of tooth size and dental crowding.Am J Orthod 1981;79:326-35.
11. Lavelle CLB. Maxillary and mandibular tooth size in different racial groups and in different occlusal categories. Am J Orthod1972;61:29-37.
12. Bishara SE, JakobsenJR,Abdallah EM, FernandezGarcia A. Comparisons of mesiodistal and buccolingual crown dimensions of the permanent teeth in three populations from Egypt, Mexico, and the United States. Am J Orthod Dentofacial Orthop 1989;96:416-22.
13. Jaroontham J, Godfrey K. Mixed dentition space analysis in a Thai population. Eur J Orthod 2000;22:127-34.
14. Priya S, Munshi AK. Formulation of a prediction chart for mixed dentition analysis. J Indian SocPedodPrev Dent 1994;12:7-11.
15. Lee-Chan S, Jacobson BN, Chwa KH, Jacobson RS. Mixed dentition analysis for Asian-Americans.Am J Orthod Dentofacial Orthop 1998;113:293-9.
16. Schirmer UR, Wiltshire WA. Orthodontic probability tables for black patients of African descent: mixed dentition analysis. Am J Orthod Dentofacial Orthop 1997;112:545-51.
17. Diagne F, Diop-Ba K, Ngom PI, Mbow K. Mixed dentition analysis in a Senegalese population: elaboration of prediction tables. Am J Orthod Dentofacial Orthop 2003;124:178-83.
18. Moyers RE. Handbook of orthodontics. 4th ed. Chicago: Year Book Medical Publishers; 1988:p. 577.
19. Crosby DR, Alexaander CG. The occurrence of tooth size discrepancies among different malocclusion groups.Am J Orthod Dentofacial Orthop; 1989;95:457-61. |