Introduction:
Evaluation of the orthodontic patient's soft tissue profile is critical for orthodontic diagnosis and treatment planning.[1]. The cephalometric analysis of the hard tissue structures of the face is relatively less complicated. [2] Landmarks are identified to represent various skeletal and dental structures; distances, angles and ratios are calculated to quantify the profile. However, curved surfaces of the soft tissue also must be reduced to distances, angles and ratios - a procedure that is much less precise than simply connecting hard tissue landmarks. [3] A review of the literature shows that there has been no consistency in the construction of lines for the analysis of soft tissue contours and quantification of a specific soft tissue contour may vary according to the method used in the analysis. [4],[5]
Taking this into consideration, the present study was done to compare the measurements obtained from two methods of soft tissue analysis; one based on the use of anatomic points and the other on the use of tangent lines in the construction of angles and the intra-observer and inter-observer reproducibility of both the methods was assessed.
Aims and Objectives:
To evaluate and compare the measurements obtained from these two different drawing methods of soft tissue analysis
To assess the intra-observer and inter-observer reproducibility for both these methods.
Methods and Materials:
Source of Data
Lateral cephalograms of Forty (Twenty males & Twenty females) individuals with normal occlusion who possessed good facial esthetics and had no history of orthodontic treatment, were the source of data.
Method of Collection of Data
Lateral cephalograms of all the individuals selected for the study were taken in natural head position and were traced on cellulose acetate paper using a pencil with 0.5mm diameter lead.
Each tracing was photocopied six times (three for anatomic point method & other three for tangent line method). First tracings (T1) for both the methods were done by the primary investigator. To assess the intra-observer reproducibility the drawings were executed a second time (T2) by the primary investigator, for both the methods and to assess inter-observer reproducibility, a second investigator independently constructed each tracing (T3) for all the subjects and for both the methods. While tracing the cephalograms, the orientation plane used in this study was the Frankfort Horizontal, as determined by the location of anatomic Porion and Orbitale in the cephalometric radiograph. The Nasion Perpendicular was determined by constructing a line inferior to Nasion and perpendicular to the Frankfort horizontal and ten variables were selected to quantify the contour of the facial region according to the method described by McNamara et al .
For the Anatomic Point Group, ten corresponding angles were drawn as shown in (Figure 1) and to construct the corresponding ten angles using the tangent line method (Figure2) tangential lines were drawn to the soft tissue contour in each region according to the method described by Mc Namara et al as follows:
Forehead tangent
Sub glabellar tangent
Nose dorsum tangent
Inferior contour tangent of nose
Upper lip tangent
Lower lip tangent
Anterior contour tangent of chin
Inferior contour tangent of chin
The intersection of these tangents were established as tangential landmarks.
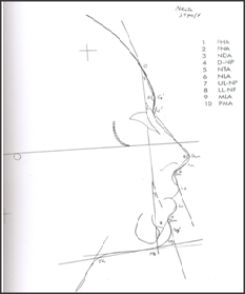 | Figure 1: Construction Of Angles Using Anatomic Points
 |
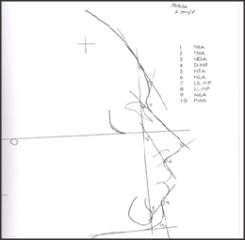 | Figure 2: Construction Of Angles Using Tangent Lines
|
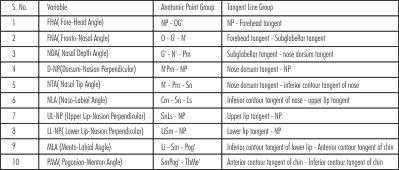 | The following table summarizes the definitions and drawing methods for both the groups:
|
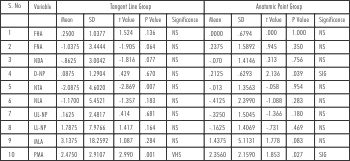
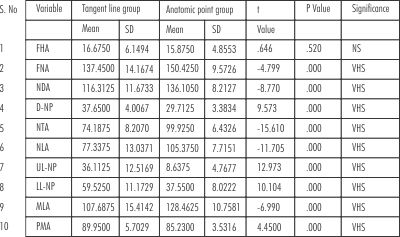 | Table 1 Comparison Of The Measurements Between Tangent Line And Anatomic Point Methods
|
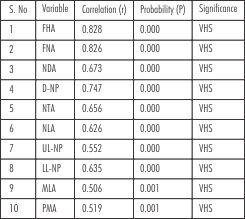 | Table 2 Pearson Correlation Coefficient Between Tangent Line And Anatomic Point Group
|
Angles between adjacent tangents were measured as an attempt to quantify the contours of facial region. Ten angles were measured, either as the intersection of two adjacent tangents or the intersection of a tangent with the Nasion Perpendicular.
Methods used for Statistical Analysis:
The data thus collected was statistically analyzed by using the following methods:
1. The mean and standard deviation of the cephalometric measurements were calculated and comparison of the measurements between
tangent line group and anatomic point group were made for measurements obtained from T1 drawings, T2 drawings, average of T1 and T2 drawings (T12) and T3 drawings by using the students unpaired ‘t’ test and the comparisons were made between First (T1) and Second (T2) drawings; between First (T1) and the drawings executed by 2nd drawer (T3); between 2nd drawings executed by the primary drawer (T2) and (T3) and between average of T1 and T2 (T12) and T3 in each group by using students paired 't' test. The 't values' thus obtained were compared with the standard table as described previously.
2. Pearson Correlation Co-efficient between the two drawing methods; between the first (T1) and second (T2) drawings and between two drawers were calculated.
Results:
1. Comparison of the measurements between methods
It was found that all the variables except for the Fore Head Angle (FHA) showed a very highly significant difference (P value < 0.001) between the two drawing methods. There were major differences (more than twenty degrees) for Nasal Tip Angle (NTA); Naso Labial Angle (NLA); Upper Lip-Nasion Perpendicular (UL-NP); Lower Lip-Nasion Perpendicular (LL-NP) and Mento Labial Angle (MLA). (Table - 1). All the variables had statistically significant Pearson correlation coefficients (Table - 2).
2. Intra-observer reproducibility
The results showed that there was statistically significant difference between the first (T1) and the second (T2) measurements in two variables viz. Nasal Tip Angle (NTA) and Pogonion Menton Angle (PMA), when the tangent line method was used. When the anatomic point method was used, two variables viz. (Dorsum-Nasion Perpendicular (D-NP) and Pogonion Menton Angle (PMA) showed statistically significant difference (Table 3). Pearson correlation coefficients were calculated between 1st (T1) and 2nd (T2) drawings in each group and it was found that they showed a very highly significant (P < .001) correlation for both the methods (Table 4).
 | Table 3 - Comparison And Differences Between First (T1) And Second (T2) Drawing In Each Group (Intra Observer Reproducibility)
|
 | Table 4 - Pearson Correlation Coefficients Between First (T1) And Second (T2) Drawing In Each Group (Intra Observer Reproducibility)
|
3. Inter observer reproducibility
Comparisons were made between the (T1) and (T3) drawings; between the (T2) and (T3) drawings and between (T12) and (T3)drawings in each group. The results of the students 'paired t-test' between the measurements showed that there were statistically significant difference for one variable (Pogonion Menton Angle (PMA) when the anatomic point methods was used whereas five variables (Nasal Tip Angle NTA; Upper Lip-Nasion Perpendicular UL-NP; Lower Lip-Nasion Perpendicular, LL-NP; MentoLabial Angle, MLA; and Pogonion Menton Angle, PMA;) showed statistically significant difference when tangent line method was used for T1, T2, T3 values .When T2 measurement was compared with T3 measurements it was found that 2 variables MentoLabial Angle, MLA; and Pogonion Menton Angle, PMA;) showed statistically significant difference in the anatomic point method where as five variables (Nasal Tip Angle, NTA; NasoLabial Angle, NLA; upper lip-nasion perpendicular (UL-NP), lower lip nasion perpendicular (LL-NP) and pogonion menton angle, PMA;) showed statistically significant different when the tangent line method was used .When the comparison was made between average of T1 and T2 drawings (T12) and T3 drawings it was found that only one variable (pogonion menton angle PMA) showed statistically significant difference when the anatomic point method was used where as 6 variables (nasal tip angle, NTA; nasolabial angle, NLA; upper lip-nasion per perpendicular UL-NP; lower lip-nasion perpendicular, LL-NP; mentolabial angle, MLA; and pogonion menton angle PMA) showed statistically significant difference when the tangent line method was used.These findings have also been summarized in (Table 5). Karl Pearson correlation coefficients were calculated for the above measurements between the two drawers and were found to be statistically significant. These findings have also been summarized in (Table - 6).
Discussion:
Soft tissue profile evaluation of the patient is comparatively more different and unreliable compared to the hard tissue assessment because of either variable soft tissue drape thickness,[6] inconsistency, unreliability of reproducibility[7] or growth changes or because of poorly defined landmarks to evaluate the soft tissue profile.[8] The methods and variables used in the present study were selected as these are the most commonly used[9] ones in the clinical practice. The analysis of the results obtained from this study showed that while comparing the accuracy of measurements obtained by using the two methods 3, it was found that nine of the ten variable selected for this study in each method differed significantly from one another which in itself is a strong indication that it is imperative to use a more precise methodology while evaluating a soft tissue variable.
While evaluating intra observer reproducibility it was found that two variables in the anatomic point method and two variables in the tangent line method presented significant differences between the first and second measurements. Thus, the use of the anatomic point method or tangent line method did not show much difference as for as intra observer reproducibility is concerned. From the analysis of these results it is evident that the inter observer reproducibility was more reliable in anatomic point method than in the tangent line method. The present study found that the anatomic point method has superior reproducibility than the tangent line method. It would not be prudent to say that the soft tissue measurements should be obtained by the anatomic point method and this study strongly indicates that there is a need for further evaluation with a larger sample size from different ethnic groups.
References:
1. MC.Namara J.A Jr. , Brust E.W., Riolo M.L.: Soft tissue evaluation of individuals with an ideal occlusion and a well balance face. In: Mc Namara J A, ed. Esthetics and the treatment of facial form. Craniofacial Growth Series. Ann Arbor, Mich: Center for Human Growth and Development, The University of Michigan; 1992: 115-146 .
2. MC Namara J.A. Jr , & E. Ellis: Cephalometric analysis of untreated adults with ideal facial and occlusal relationships. Int. J. Adult Orthod, Orthognathic Surg. 1988; 3: 221-231.
3. Hyeon -Shik Hwang, Wang -Sik Kim and Mc Namara J.A. Jr.: A Comparative study of two methods of quantifying the soft tissue profile. Angle Orthod 2000; 70: 200-207.
4. Christie, T.E.: Cephalometric patterns of adults with normal occlusion. Angle Orthod 1977; 47: 128-135.
5. Steiner, C.C.: Cephalometrics for you and me. Am. J. Orthod., 1953; 39:729-755.
6 E. Hillesund, D. Fjeld and B.U. Zachrisson: Reliability of soft tissue profile in cephalometrics Am. J. Orthod.1978; 74:537-550
7. Meng H., Goorhuis, Nanda R.S, and Kapila : Growth changes on the soft tissue facial profile. Angle Orthod. 1990; 60:177-190.
8. Baumrind S, and Frantz R.: The reliability of head film measurements. Am. J. Orthod, 1971; 60: 111-127; 505- 517.
9. Substelny. J.D., Rochester, N.Y.: A longitudinal study of soft tissue facial structures and their profile characteristics defined in relation to underlying skeletal structures. Am. J. Orthod., 1959; 45:481-507. |